Download
1 / 1
10 likes | 162 Vues
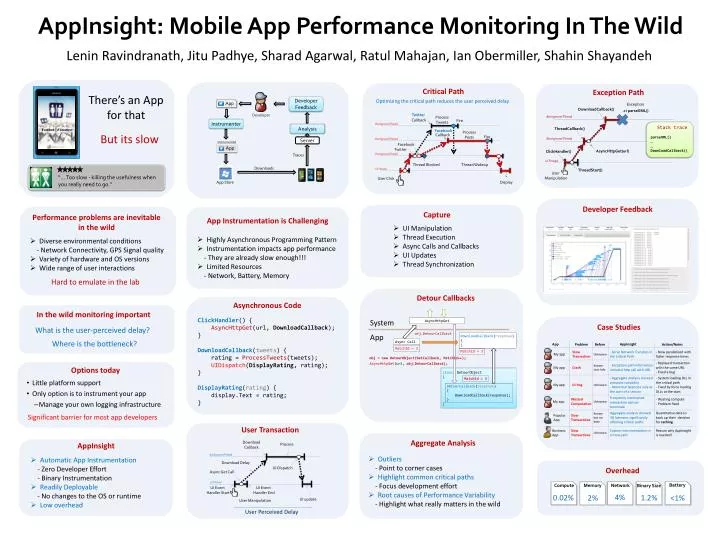
AppInsight: Mobile App Performance Monitoring In The Wild. App. Slow Transaction. - Serial Network Transfers in the Critical Path. - Now parallelized with faster response times. My app. Unknown. - Replayed transaction with the same URL - Fixed a bug.

E N D
AppInsight: Mobile App Performance Monitoring In The Wild App Slow Transaction - Serial Network Transfers in the Critical Path - Now parallelized with faster response times My app Unknown - Replayed transaction with the same URL - Fixed a bug - Exception path information included http call with URL Known Less Info My app Crash - Aggregate analysis showed compute variability - Abnormal latencies only at the start of a session - System loading DLL in the critical path - Fixed by force loading DLLs at the start Lenin Ravindranath, Jitu Padhye, Sharad Agarwal, Ratul Mahajan, Ian Obermiller, Shahin Shayandeh Stack trace parseXML() … … DownloadCallback() My app UI hog Unknown App Frequently interrupted transaction did not terminate Wasted Computation - Wasting compute - Problem fixed My app Unknown Aggregate analysis showed 3G latencies significantly affecting critical paths Quantitative data to back up their decision for caching Known but no data Popular App Slow Transactions Critical Path Exception Path There’s an App for that Business App Slow Transactions Custom instrumentation in critical path Reason why AppInsight is needed! Developer Feedback Optimizing the critical path reduces the user perceived delay Unknown Exception DownloadCallback() at parseXML() Twitter Developer Background Thread Process Tweets Callback Fire Instrumenter Background Thread Analysis ThreadCallback() Facebook Process Posts But its slow Callback Fire Background Thread Background Thread Server Instrumented Facebook Twitter AsyncHttpGet(url) ClickHandler() Background Thread Traces UI Thread Thread Blocked Thread Wakeup Downloads UI Thread ThreadStart() User Manipulation “… Too slow - killing the usefulness when you really need to go.” User Click App Store Display Developer Feedback Capture Performance problems are inevitable in the wild App Instrumentation is Challenging • UI Manipulation • Thread Execution • Async Calls and Callbacks • UI Updates • Thread Synchronization • Highly Asynchronous Programming Pattern • Instrumentation impacts app performance • - They are already slow enough!!! • Limited Resources • - Network, Battery, Memory • Diverse environmental conditions • - Network Connectivity, GPS Signal quality • Variety of hardware and OS versions • Wide range of user interactions Hard to emulate in the lab Detour Callbacks Asynchronous Code In the wild monitoring important ClickHandler() { AsyncHttpGet(url, DownloadCallback); } DownloadCallback(tweets) { rating = ProcessTweets(tweets); UIDispatch(DisplayRating, rating); } DisplayRating(rating) { display.Text = rating; } System AsyncHttpGet Case Studies What is the user-perceived delay? obj.DetourCallback App DownloadCallback(response) { } Where is the bottleneck? Async Call App AppInsight Problem Before Action/Notes MatchId = 3 MatchId = 3 obj = new DetourObject(GetCallback, MatchId++); AsyncHttpGet(url, obj.DetourCallback); Options today class DetourObject { } MatchId = 3 • Little platform support • Only option is to instrument your app • Manage your own logging infrastructure DetourCallback(response) { DownloadCallback(response); } Significant barrier for most app developers User Transaction Aggregate Analysis Download Callback AppInsight Process Background Thread • Outliers • - Point to corner cases • Highlight common critical paths • - Focus development effort • Root causes of Performance Variability • - Highlight what really matters in the wild • Automatic App Instrumentation • - Zero Developer Effort • - Binary Instrumentation • Readily Deployable • - No changes to the OS or runtime • Low overhead Download Delay UI Dispatch Overhead Async Get Call UI Thread Battery Memory Compute Network Binary Size UI Event Handler Start UI Event Handler End 4% 0.02% 1.2% 2% <1% UI update User Manipulation User Perceived Delay