Download
1 / 37
370 likes | 518 Vues
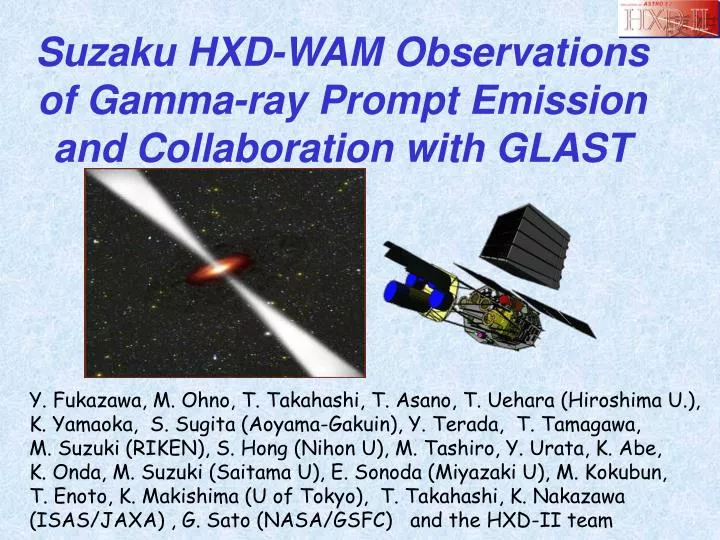
Suzaku HXD-WAM Observations of Gamma-ray Prompt Emission and Collaboration with GLAST. Y. Fukazawa, M. Ohno, T. Takahashi, T. Asano, T. Uehara (Hiroshima U.), K. Yamaoka, S. Sugita (Aoyama-Gakuin), Y. Terada, T. Tamagawa, M. Suzuki (RIKEN), S. Hong (Nihon U), M. Tashiro, Y. Urata, K. Abe,

E N D
Suzaku HXD-WAM Observations of Gamma-ray Prompt Emission and Collaboration with GLAST Y. Fukazawa, M. Ohno, T. Takahashi, T. Asano, T. Uehara (Hiroshima U.), K. Yamaoka, S. Sugita (Aoyama-Gakuin), Y. Terada, T. Tamagawa, M. Suzuki (RIKEN), S. Hong (Nihon U), M. Tashiro, Y. Urata, K. Abe, K. Onda, M. Suzuki (Saitama U), E. Sonoda (Miyazaki U), M. Kokubun, T. Enoto, K. Makishima (U of Tokyo), T. Takahashi, K. Nakazawa (ISAS/JAXA) , G. Sato (NASA/GSFC) and the HXD-II team
Suzaku Wideband All-sky Monitor (WAM) Suzaku/HXD thick (4cm) large (38cm) 20 BGO crystals Anti for lowering the BGD of main detector All-sky monitor with high stopping 4cm 38cm top view cross-section
WAM Advantage for GRB observations Large effective area Highest sensitivity from 300 to 5000 keV Effective area : 800cm@300keV 400cm@1MeV Swift-BAT No alert system GLAST LAT cross section top view Moderate time resolution Effective area HXD-WAM 0.5sec 55ch (continuous) or 1/64sec 4ch (128s length) GLAST-GBM (BGO) 100 1000 10000 (keV)
GRB observations with WAM~Trigger status~ Lightcurve samples 22 Aug 2005 --- 07 Jan 2007 Short GRBs Single peak Localized GRB 26 Confirmed GRB 112 Possible GRB >30 Multiple peak GRB detection rate is ~120 / year
Simultaneous Detectrion of GRBs with other satellites number(triggered) Swift 35 (15) Konus 88 (56) HETE-2 9 (4) INTEGRAL/SPI 31 (19) INTEGRAL/IBIS 2 (0) GCN Circulars (as of 2006 Sep) WAM:9GRB051008, GRB051111, GRB051221A, GRB060111B, GRB060117, GRB060429, GRB060813, GRB060814, GRB060904A IPN :5GRB060213,GRB060303,GRB060425,GRB060429,SGR1806-20(2) Joint:1GRB060813 Light curves and Spectra are available at http://www.astro.isas.jaxa.jp/suzaku/HXD-WAM/WAM-GRB/
SGR (Soft Gamma-ray Repeater) SGR1806-20, 1900+14 Solar Flares Dec 01, 2005 SGR1806-20 >30 triggers (X,C-class) Dec 05, 2006 X6.5 These data will be also useful with the GLAST data.
Earth Occultation step by WAM Crab occultation step Time (sec)
Month/Year monitoring of soft-gamma-ray sources is available Crab CygX-1 100 500 (keV) Preliminary GRO J1655-40 Cen A
Calibration 511 keV count rate WAM is located inside the satellte body. Side1 Ground calibtation move along this line Side2 Side0 Suzaku Mass Model HXD-II (inside satellite) RI Geant 4 Side3 Konus WAM Swift Inflight Calibration Cooperation with Swift, Konus-Wind by using the same GRBs Crab by the earth occultation <30% accuracy for the response
Good matiching with GLAST Field of view Similar orbit (LEO, 30deg incl.) Same BGO detector Collabo. in Calibration and BGD Highest sensitivity around GRB peak WAM Depending on the Suzaku attitude WAM 30% of GLAST GRBs may be Detected with WAM.
GRB results 1. Epeak distribution 2. short GRBs vs long GRBs hardness, spectral delay… 3. Spectral Evolution
1. Epeak Distribution toward the higher energy MeV emission is clearly detected from GRBs ! GRB051008 GRB060213 GRB060317 MeV emission !
Simultaneous fits with other satellites strongly constrain the spectral shape and then Epeak. WAM Konus Swift
Comparison of Epeak dist. BATSE WAM Kolgomorov-Smilnov probability: ~15% It seems allmost similar ? 100 1000 10000(keV) Still need more study. Selection effect ? More sample Hope with GLAST
2. Short GRBs vs Long GRBs T90 distribution T90 distribution shows bimodal structure same as BATSE T90 (sec)
We pick up 4 bright short GRBs (Konus, IPN). Constrained the Epeak accurately. Epeak is constarined to be 1-5 MeV.
Short GRBs Redshift-dep. Long GRBs E peak E iso Different origin between short and long
Spectral lag TH0:50-110keV TH1:110-240 TH2:240-520 TH3:520-5000 Cross Correlation Function (CCF) Long GRB Short GRB CCF CCF TH0toTH1 TH0toTH2 TH0toTH3 0 0.5 1 (sec) 0 2 4 (sec) Spectral lag No spectral lag
Spectral lag Energy index Hardness Ratio 100-300keV 50-100keV Toward low energy duration HR32 Long Short Long short long short index(α) duration Lag Short GRBs vs Long GRBs Different Lorentz Factor? Different physics of emission?
3.Spectral Evolution of GRBs~ variability upto MeV enegy band ~ Spectral evolution upto MeV band from some GRBs GRB070125 50-110keV 110-240keV 240-520keV 520-5000keV
GRB051008 Variable Epeak GRB060213 Constant Epeak GRB060813 Variable Epeak lightcurve 2000(keV) 2000 500 Epeak Epeak Epeak 200 500 500 Time since trigger(sec)
Time resolved analysis 1 sec resolved analysis GRB 061007 Lihgt Curve Band a Band b (keV) Epeak
Epeak – Eiso scatter plot for the time-resolved data of GRB 061007 Most data satisfy Ep ∝ Liso0.5 Epeak Outlier? Higher Ep? Luminosity at the beginning of flares Physical state transition? This will be important to constrain the physics of the central engine.
Expected science with GLAST GRB940217 WAM Smooth hard tail ? Cut-off + other tail? Epeak distribution? Emission mechanism Synchrotron? Hadron? Spectral evolution of the high energy tail. WAM WAM will give a good photon statistics around 100—5000 keV, to constrain the spectral shape and trace the spectral evolution. Energy (keV) 102 103 104 (keV)
Summary WAM observations of GRBs Some detailed spectral and timing analyses are being available Ep distribution is similar(broader?) as BATSE Different properties between Short and Long Spectral evolution .. etc WAM has been giving more accurate measurements of spectra and timing of prompt emission, following BATSE. Collaboration with GLAST is hoped to open the new window for the high energy GRB emisson !
II. WAM performance Comparison with other GRB missions Suzaku Swift BATSE HXD-WAM BAT LAD Energy range 50 – 5000 15 – 150 20 – 2000 (keV) Energy resolution 30% **% 20% ( @662keV) Effective area 400 5000 150 Time resolution 31.25ms ** ms 2 ms HXD-WAM is very useful for GRB observation in hard X-ray band complementary with Swift-BAT.
100-300 keV Fluence distribution BATSE 4B WAM samples WAM sample は、 特に明るいものばかりというわけでもない(?) Fluence (log) erg/cm2
Observations No problems on the hardware From Aug 25 – 2005 to Nov 2006, WAM detected 160 self-triggerred GRBs and possible GRBs. (~100 per 1 year)
III. Resultsand DiscussionA. Time averaged analysis 45個のうち、31個のGRBにおいて、simple PL よりも cutoffPL,Band model で fit 改善->Epeakを決めることができた Short GRB 060429 Long GRB 051008 1sec 50sec
IV. WAM+BAT joint analysis~ Epeak with WAM-BAT joint fitting ~ Many GRBs can be determined the Ep by joint fit with Swift/BAT Epeak (keV) GRB051008 GRB051111 GRB051221 GRB060105 GRB060111 GRB060117 GRB060306 GRB060501 GRB060502 WAM+BAT joint fit is very powerful tool for Ep !
IV. WAM+BAT joint analysis ~ Epeak distribution ~ Epeak distribution from all position determined GRBs (WAM-BAT joint fit + IPN localized GRBs) Number of events • WAM results • normalized • BATSE results Similar to BATSE results but Broader in high energy band than BATSE ?? more samples are required ! Ep (log)
IV. WAM+BAT joint analysis ~ Ep-Eiso correlation ~ GRB051221 short GRB (z=0.54) Short GRB does not meet Amati relation (Amati et al. 2006) GRB050904 Highest redshift(z=6.29) high-z GRB also satisfies Amati-relation GRB05111 long GRB(z=1.55) WAM only detected hard prompt emission Ep-Eiso correlation from WAM+BAT Ep,src(keV) Eiso(1052erg)
II. GRB sciences with the WAM Obtain the unbiased Epeak distribution. Preece et al. 2000 • There are few sample of • high energy Epeak. • High sensitive observation • up to MeV region is needed. 100 1000 Gonzalez et al. 2003 Does MeV-GeV excess emission really exists? What’s origin? WAM • Delayed excess emission against • main synchrotron emission. • Time variability around MeV region • is important. 102 103 104 (keV)
Comparison of Epeak dist. BATSE WAM Kolgomorov-Smilnov probability: ~15% It seems allmost similar ? 50-300 keV 256ms pkflux 10 100 1000 10000 Selection effect ? Epeak は明るさに比例する という報告(Shaefer 2003)。 同じような明るさのGRBを捉えて いたとするならば、分布は 似てくるかも 0.1 1 10 100 1000
IV. Spectral Evolution of GRBs~ variability upto MeV enegy band ~ Time variability upto MeV band from some GRBs • Search for spectral evolution in MeV region • Detail analysis is in progress GRB051008 GRB060213 50-100 keV 100-300keV 300-500keV 500-1000keV 1000-2000keV
IV. WAM+BAT joint analysis~ joint fitting with Swift/BAT ~ Some GRBs are detected by WAM and Swift/BAT simultaneously WAM+BAT joint fitting WAM • More wide coverage • for Epeak • Cross calibration • for each other Swift/BAT 10 - 20 % Now, WAM response uncertainty was fixed within 10-20% in more than 100 keV band