Download
1 / 43
430 likes | 560 Vues
2005 Financial results. Slide show - April 11, 2006. Speakers. Yves REVOL Chairman of the Board and CEO Sales Director of CLASQUIN, he took over the company in 1983 as part of a MBO. Manages the development of the Group. Philippe LONS Deputy General Manager and CFO

E N D
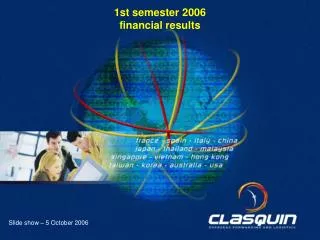
2005 Financial results Slide show - April 11, 2006
Speakers Yves REVOL • Chairman of the Board and CEO • Sales Director of CLASQUIN, he took over the company in 1983 as part of a MBO. • Manages the development of the Group. Philippe LONS • Deputy General Manager and CFO • Joined CLASQUIN in 1986. After an international career within the Group, notably in Asia, he became the CFO of CLASQUIN in 1995.
A high added value business model An extremely competitive position A strong growing market Introduction • CLASQUIN : A unique player in its market • 2005 highlights
Business: overseas* air and sea freight forwarding and logistics. CLASQUIN: a Pure Player in overseas forwarding organizes and manages flows of merchandise between France and the world specialist in Asia/Pacific and North America The only multinational SME in the sector: 33 offices in the world / 325 employees CLASQUIN in 2005: Sales: M€ 92.3 (+30,7% vs 2004) EBIT: M€ 3.3 (+60,4% vs 2004) CLASQUIN • A unique player in its market * intercontinental
A high added value business model CLASQUIN 4PL (non-physical assets companies) 3PL Logistics providers Port and airport handling agents, brokers, forwarders … Basic operators (road, air, sea carriers, … suppliers of storage zones, …) • CLASQUIN selects and guides a network of the best sub-contractors *4PL : Fourth Party Logistics Provider - Source : Les Echos / Merrill Lynch
Entreprises moyennes Entreprises moyennes Grandes entreprises Pure Player et diversifiées : SDV (Gpe Bolloré), Panalpina, K&N, Expeditors, …) et grandes entreprises diversifiées Grandes entreprises Pure Player et diversifiées : SDV (Gpe Bolloré), Panalpina, K&N, Expeditors, …) et grandes entreprises diversifiées Micro sociétés Micro sociétés Deutsche Post (DHL), Schenker, … Large Pure Player companies (SDV -Gpe Bolloré, Panalpina, K&N, Expeditors, …) and large diversified companies Medium sized companies small companies A strong competitive positioning • Only multinational SME, Pure player of the overseas A fragmented and concentrating sector Customer size Worldwide companies National and international companies Small and medium sized local companies Proximity to customers Company size Customer service Barrier of the network and IT tool Proximity to customers Industrial tailor-made solutions Géants : Deutsche Post (DHL), Schenker, … Géants : Deutsche Post (DHL), Schenker, …
Growth in world air freight: • + 6% per year by 2020 (source: OECD) • Intra Asia: + 8.5% • of which China: + 14% (source: IATA) A strong growing market Fast growth in world trade Explosion of the Asia / France* trade * source: French customs • Growth in world sea freight: • + 8.5% per year by 2020 (source: OECD) • (Growth in container freight: 3 times higher than world GDP)
Fast growth of sales and results Sales = M€ 92.3 (2004 = M€ 70.6) : + 30 % Net result = M€ 2.1 (2004 = M€ 1.1) : + 86 % New customers Kenzo, Camaïeu, Ripcurl, Technip, Cogema … Continuation of our development strategy opening of new offices: Tours, Grenoble, Pyongyang, Canton buying out of a company in Thailand: CLASQUIN THAILAND reinforcement of sales forces in France and Asia Launching of an Excellence Plan for Operation (EPO) including CRM 2005 highlights
Plan of the presentation 1 – Our business: overseas air and sea freight forwarders 2 - 2005 financial results: acceleration of growth and results 3 – An ambitious and controlled development strategy
1- Our business: overseas air and sea freight forwarders - Organization diagram and example of operation - Our customers portfolio - The key factors of our success
Our business: overseas air and sea freight forwarding Organization of intercontinental logistics Intercontinental Transports Logistic operations Logistic operations IMPORT CLIENT EXPORT CLIENT • CLASQUIN : architect and manager of the entire overseas • transportation and logistic chain
A tailor-made offer An example: delivery of Beaujolais Nouveau to Japan the 3rd Thursday of November PRODUCERS CUSTOMERSS in Tokyo, Nagoya and Osaka In France 250 000 bottles CLASQUIN IT System Day 1 Day 2 Day 3 Warehouse Airports Airports Air freight
A tailor-made offer CLASQUIN’s added value: • Ability to operate the door-to-door overseas flows for our customers • Efficiency: a sole contact for customers • Optimization of costs and deadlines • Expertise in airfreight, seafreight, overseas logistics ,customs, insurances, etc … • Traceability • Selection of the best sub-contractors • etc…
FASHION & LUXURY CONSUMPTION GOODS CAPITAL GOODS PHARMACEUTICALS& COSMETICS WINES & SPIRITS RETAILING OTHERS… Customers profile • A stable and diversified customer portfolio ABB, Carrefour Asia, Casino, Catimini, Chantelle, Damart, DDP, Gerflor, Haulotte, Hyundai Elevator, Kenzo, King Jouets, La Redoute, Le Tanneur, Lacoste, Lanvin, Mango, Michelin, Mitsubishi, Mitsui & Co, Promod, Quicksilver, Ripcurl, Saint James, Salomon, Samsung, Yamamoto,… • The 30 first customers represent less than one third of total sales • (the first one represents less than 4%) • 50% of the top 20 have been customers for more than 10 years
A history of a successful development Staff The integrated network The integrated information system The key factors of our success
1983 1990 2005 92 15 Sales in M€ 1,5 325 95 Employees 15 33 offices Lyons + Paris of which Agencies in Network Lyons 20 overseas Asia & Australia Multinational Information system National Local A history of successful development • Average growth > 20%
Staff: the Group’s wealth Highly selective recruiting Proven ability for hiring talents and keeping them A top-level management, stable and experienced 30% of the executives have been with us for over 10 years International operation and sales teams 90% of the staff is bilingual and graduated Strong motivation and involvement of teams: organized in independent profit centers High-level expertise: international regulations, customs regulations, insurance regulations, bank regulations, … The key factors of our success
For the rest of the world: The World Freight Alliance covering 130 countries WFA The key factors of our success • An integrated network: 14 subsidiaries, 33 offices on 4 continents • Forerunner on the France-Asia route: first implementation in 1983 Asia Pacific (since 1983) 16 offices (5 in China) France and Southern Europe 13 offices United States (since 1993) 4 offices
Our integrated information system, evolutive and efficient The key factors of our success • A strategic tool • Developped in-house since 1990 • Dimensioned to absorb the future growth of the Group • A complete range of tools: • operations management: processing of orders, monitoring of operations, logistics process, invoicing, monitoring of profitability, … • interconnection with customers in real time: logistics and documentary traceability, EDI exchanges… • Group monitoring: reporting, cash management, management control, … • Growth and profitability benefit fully from investments made
2 – 2005 results: Acceleration of growth - Evolution and breakdown of activity - Management ratios - Statement of cash flows and balance sheet structure
2003 2004 2005 2005: acceleration of growth • 2003/2005consolidated sales trend (in M€) 30,7% 8,5% • reinforcement of the front office • fast development of international trade • mechanical effect of the fuel surcharge
2005: acceleration of growth • 2004/2005 sales trend per geographical area (in M€) 26% 32% 63% 2% Before consolidating entries and Log System excluded (in-house software and services company)
2005: acceleration of growth • Breakdown of sales per geographical area (in %) 49 49% 40% 48% 41% 4% 7% 5% 6% 2004 sales 2005 sales Before consolidating entries and Log System excluded (in-house software and services company)
2005: acceleration of growth • 2004/2005 sales trend per activity (in M€) 27% 38% 10% Log System excluded (in-house software and services company)
2005: acceleration of growth • Breakdown of sales per type of freight (in %) 4% 3% 38% 40% 48 41 58% 57% 2004 sales 2005 sales Log System excluded (in-house software and services company)
2003 2004 2005 2005: acceleration of growth • Gross profit • 2003/2005 consolidated trend (in M€) 23,5% • a benchmark more relevant than sales • the Group’s benchmark to evaluate performance ratios
2003 2004 2005 2005: acceleration of growth • EBITDA • 2003/2005 consolidated trend (in M€) 31,4% • benefits from economies of scale
2003 2004 2005 2005: acceleration of growth • EBIT • 2003/2005 consolidated trend (in M€) • Breakdown of 2005 EBIT per • geographical area (in %) 60,4% 46% 40% 10% 4% • benefits from decreasing capital allowances
2003 2004 2005 2005: acceleration of growth • Sharp rise of consolidated net earnings (after minority interests) • 2003/2005 consolidated trend (in M€) 86,4%
Income statement balance • Fast growth of profitability ratios
Cash flow statement • a highly volatile daily WCR • a standard WCR in constant improvement • financial expenses decreasing constantly In M€2003 2004 2005 Operational cash flow 1.32 2.26 3.28 Variation in WCR (factoring excluded) 0.66 0.01 - 3.69 Variation in the use of factoring* 0.79 2.28 3.70 Variation in WCR after factoring 1.45 2.29 - 0.01 Total cash flow from operating activities 2.77 4.56 3.29 Cash flows from investing activities - 0.75 - 0.59 - 1.20 Cash flow from financing activities - 1.00 2.66 - 0.13 including capital increase 2.00 issue of convertible bonds 0.50 Variation in net cash 1.02 6.63 1.95 Variation in net cash excluding factoring 0.23 4.35 - 1.75 Net cash on closing after FX impact 2.62 9.25 11.29 Net cash on closing excluding factoring after FX impact - 4.28 0.07 - 1.59 * Net stock of receivables sold to factoring 6.90 9.18 12.88
Simplified balance sheet at Dec. 31, 2005 • Without factoring • With factoring Fixed assets M€ 2.67 Equity and minority interets M€ 5.48 (including M€ 0.5 convertible bonds) 7,67 M€ Fixed assets M€ 2.67 Equity and minority interests M€ 5.48 (including M€ 0.5 convertible bonds) Provisions M€ 0.55 Loans and MLT financialdebts M€ 1.64 Trésorerie nette 9,11 M€ Net cashflow M€ 11.29 Working capital requirements M€ 6.59 M€ 12.88 Working capital excesses M€ 6.29 Provisions M€ 0.55 Loans and MLT financial debts M€ 1.64 Overdraft M€ 1.59
GEARING / ROE / ROCE * includes the restatement of M€ 1.2 paid to airline companies by end of December
3 – An ambitious and controlled development strategy • - Sustainable and solid growth levers • - Two strategic axes of development • Acceleration of growth and performances Focus on 2006
An ambitious and controlled development strategy • Sustainable and solid growth levers 3rd growth lever A fast growing market Explosion of international trade A unique competitive positioning as a multinational SME and a positive competitive environment (concentration / giants vs minors) 2nd growth lever A Group dimensioned for growth acceleration: - people and the organization - the international network - The IT system - Customer portfolio 1st growth lever
An ambitious and controlled development strategy • Two strategic axes: • 1) – Continue our current growth strategy • Continue expanding our offer by recruiting new skills: • marketing: for sectors of activity with high added value: luxury, pharmaceuticals, wines & spirits, … • technical: truck freight forwarders, logistic specialists, … • Continue developing in our core business, the overseas: • Increase our sales forces • Pursue the extension and densification of our network: • new sales offices to be closer to customers and capture new markets: China (Tianjin, Dalian, Xiamen), Japan (Nagoya), India (New Delhi), … • new operational offices in areas with high potential of business or on transit platforms: France (Strasbourg), Belgium (Antwerp), North America (Chicago, Montreal), …
An ambitious and controlled development strategy 2) - Accelerate our growth and performances by acquisitions • Selective • On our market segment
An ambitious and controlled development strategy • As a conclusion Acceleration of growth and performances 1) – Continue our present growth strategy 2) – Accelerate this growth strategy by acquisitions Two solid strategic axes A very positive global context All growth levers are lastingly solid
Double-digit growth of sales and results Network and sales forces growth opening of a new subsidiary: CLASQUIN BELGIUM in Antwerp (01/06/06) opening of operational offices: Chicago (01/03/06), Strasbourg (01/05/06) and Madrid (on study) sales office in Delhi Means / organization Recruitement of an International Human Resources Manager Excellence Plan for Operation (E.P.O.) and CRM External growth implementation of a plan of action dedicated to future acquisitions FUTURE PROSPECTS FOCUS on 2006 2008 PLAN (external growth excluded) • sales: > M€ 117 • gross profit: > M€ 28.7 • operating result / gross profit: > 15 % with a target at 18 %
A successful IPO: a global offer subscribed nearly 17 times an open-price offer subscribed more than 15 times A balanced capital ownership on the day of the IPO: 71 institutional investors hold 446,648 shares 4,646 individual shareholders hold 49,628 shares Share performance: + 12.45 % since the IPO IPO rate (top of range): € 15.50 share listing on April 6: € 17.43 (market capitalization = M€ 38.9) Implementation of a liquidity provider’s agreement to reinforce share liquidity Net dividend to be approved by the Annual General Meeting: 0.23 € per share Calendar: June 6, 2006: Annual General Meeting in Lyons October 5, 2006: mid-year results Reminder: IPO on Alternext on Jan.31, 2006
Changes in shareholding • Shareholding before and after the IPO (in %) 16% 22% 10% 13% 46% 14% 58% 9% 10% 2006 shareholding 2005 shareholding * Directly and indirectly
2005 financial results: questions/answers Slide show - April 11, 2006