Download
1 / 31
310 likes | 411 Vues
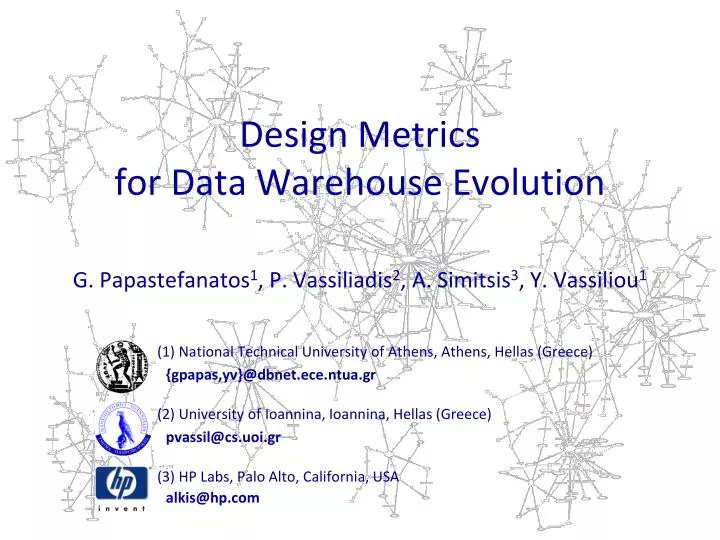
Design Metrics for Data Warehouse Evolution. G. Papastefanatos 1 , P. Vassiliadis 2 , A. Simitsis 3 , Y. Vassiliou 1 (1) National Technical University of Athens, Athens, Hellas (Greece) { gpapas,yv }@ dbnet . ece . ntua . gr (2) University of Ioannina , Ioannina , Hellas (Greece)

E N D
Design Metrics for Data Warehouse Evolution G. Papastefanatos1, P. Vassiliadis2, A. Simitsis3, Y. Vassiliou1 (1) National Technical University of Athens, Athens, Hellas (Greece) {gpapas,yv}@dbnet.ece.ntua.gr (2) University of Ioannina, Ioannina, Hellas (Greece) pvassil@cs.uoi.gr (3) HP Labs, Palo Alto, California, USA alkis@hp.com
Outline • Motivation • Graph-based modeling & DW Evolution • Metrics for data warehouse evolution • Evaluation • Conclusions ER'08, Barcelona, October 2008
Outline • Motivation • Graph-based modeling & DW Evolution • Metrics for data warehouse evolution • Evaluation • Conclusions ER'08, Barcelona, October 2008
Act3 Act4 Act2 Act5 Act1 Motivation • Data warehouses are evolving environments, e.g.: • A dimension is removed or renamed • The structure of a dimension table is updated • A fact table is completely decoupled from a dimension • The measures of a fact table change • An ETL source is modified, etc. WWW ER'08, Barcelona, October 2008
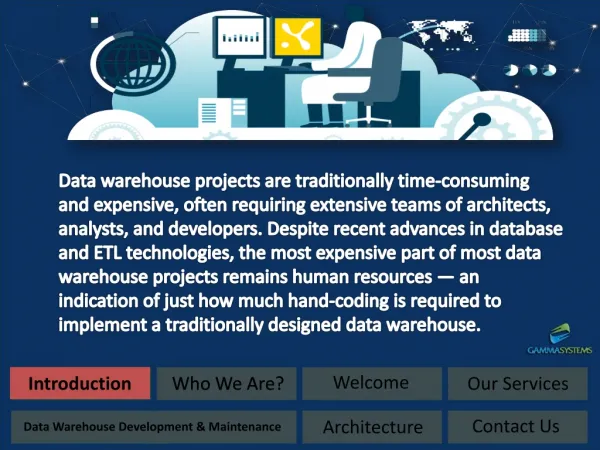
Evolution Effects • SW and data artifacts around the warehouse (e.g., ETL activities, materialized views, reports) are affected: • Syntactically – i.e., become invalid • Semantically – i.e., must conform to the new source database semantics • Adaptation to new semantics • time-consuming task • treated in most of the cases manually by the administrators/developers • Evolution-driven design is missing ER'08, Barcelona, October 2008
We would like to know… • Can we measure and quantify in a principled way the vulnerability of certain parts of a data warehouse environment and find these constructs that are most sensitive to evolution? • Can we predict and quantify the impact of a change towards the rest system? • What are the “right” measuresfor evaluating the quality of the design of a data warehouse, with respect to its evolution capabilities? ER'08, Barcelona, October 2008
Outline • Motivation • Graph-based modeling & DW Evolution • Metrics for data warehouse evolution • Evaluation • Conclusions ER'08, Barcelona, October 2008
Evolving databases Evolving applications Queries Database Schema Graph-based modeling for uniform representation Rules for Handling Evolution Metrics for Evaluating Evolution Design Data Warehouse Schema Evolution Our approach Graph based representation of database constructs (i.e., relations, views, constraints, queries) Annotation of graph with rules for adapting queries to database schema evolution Mechanism for performing what-if analysis for potential changes of database configurations ER'08, Barcelona, October 2008
Graph based representation ER'08, Barcelona, October 2008
Graph Annotation with rules ER'08, Barcelona, October 2008
Name EID Name EID Graph Adaptation Q: SELECT EID, Name FROM EMP Q: SELECT EID, Name, Phone FROM EMP Annotated Query Graph Transformed Query Graph Event ON attribute addition TO EMP THEN propagate ON attribute addition TO EMP THEN propagate Add attribute Phone to relation EMP EMP EMP map-select map-select S S … … S S EID S EID S Q Q map-select map-select S S S Name Name S map-select Phone Phone ER'08, Barcelona, October 2008
Outline • Motivation • Graph-based modeling & DW Evolution • Metrics for data warehouse evolution • Evaluation • Conclusions ER'08, Barcelona, October 2008
Simple Metrics EMP.Emp# is more “important” than EMP.SAL, w.r.t. how many nodes depend directly on it Simple: in-degree, out-degree, degree ER'08, Barcelona, October 2008
Transitive Metrics Transitive: in-degree, out-degree, degree • Variant with a view + query is more “complicated” wrt how many nodes are involved in the propagation of EMP.Emp# towards the end ER'08, Barcelona, October 2008
Zoomed-out degrees Simple degrees Transitive degrees • Only top-level nodes are retained • Only one edge between modules is retained weighted with the number of edges suppressed ER'08, Barcelona, October 2008
Entropy-based metrics Probability that a node v is affected by an event occurring on another node yi : Examples P(Q|V) = 1/3, P(Q|EMP) = 1/3, P(V|WORKS) = 1/2 ER'08, Barcelona, October 2008
Entropy-based metrics - continued Entropy of a node v: The “sensitivity” that a node v is affected by a random event on the graph. ER'08, Barcelona, October 2008
Outline • Motivation • Graph-based modeling & DW Evolution • Metrics for data warehouse evolution • Evaluation • Conclusions ER'08, Barcelona, October 2008
Testbed Configuration • TPC-DS benchmark: Web Sales schema with 3 variants • Original (1 fact – 13 dimensions) • Surrounded with views • Customer dimensions merged ER'08, Barcelona, October 2008
Distribution of Evolution Events Distr 1: Recorded from the Greek Public sector Distr 2: Migration to a pure star schema ER'08, Barcelona, October 2008
Evaluating effectiveness • Effectiveness • how well our metrics can “forecast” the impact of events over the different constructs of the schema • Configuration • we used mainly the Distr. 1 of events (real data) • we tested nine configurations based on • variations of the schema • Web Sales (WS), Web Sales extended with views (WS-views), star variant of Web Sales (WS-star) • variations of the policy • Block-All, Propagate-All, Mixture ER'08, Barcelona, October 2008
Events affecting dimensions (b) WS-star schema (a) WS schema ER'08, Barcelona, October 2008
Events affecting views WS-views schema ER'08, Barcelona, October 2008
Events affecting queries (b) WS-star schema (a) WS schema ER'08, Barcelona, October 2008
Comparison of design configurations (b) all affected nodes (a) only affected queries for Distr. 1 ER'08, Barcelona, October 2008
Comparison of design configurations (b) all affected nodes (a) only affected queries for Distr. 2 ER'08, Barcelona, October 2008
Outline • Motivation • Graph-based modeling & DW Evolution • Metrics for data warehouse evolution • Evaluation • Conclusions ER'08, Barcelona, October 2008
Conclusions • A framework for handling the impact of changes in a DW environment • A set of metrics for DW evolution • simple • transitive • entropy-based • An extensive experimental evaluation based on both, real and synthetic dataset • Platform: Hecataeus • A tool for visualizing and performing what-if analysis for evolution scenarios ER'08, Barcelona, October 2008
Gracias! Hecataeus: A tool for visualizing and performing what-if analysis for evolution scenarios http://www.cs.uoi.gr/~pvassil/projects/hecataeus/index.html ER'08, Barcelona, October 2008
Questions? http://www.cs.uoi.gr/~pvassil/projects/architecture_graph/ ER'08, Barcelona, October 2008
Gracias! Sources: http://en.wikipedia.org/wiki/Image:Barcelona_-_planol_ciutat_vella_1860.jpg http://maps.google.com ER'08, Barcelona, October 2008