Download
1 / 35
350 likes | 462 Vues
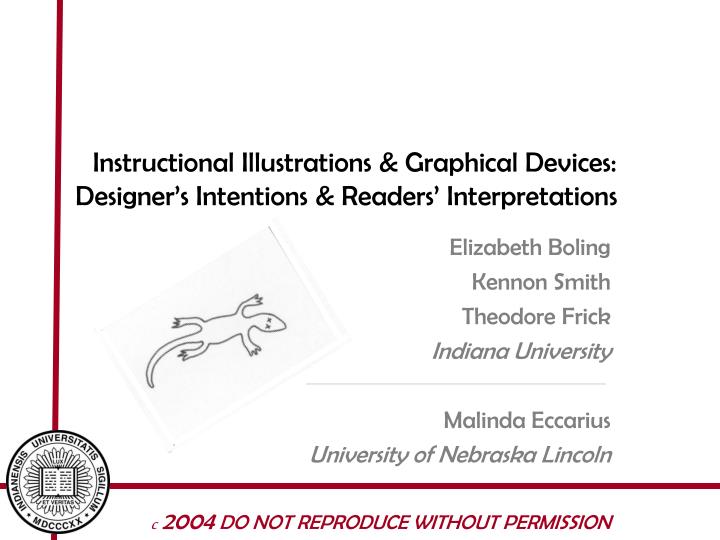
Instructional Illustrations & Graphical Devices: Designer’s Intentions & Readers’ Interpretations. Elizabeth Boling Kennon Smith Theodore Frick Indiana University Malinda Eccarius University of Nebraska Lincoln c 2004 DO NOT REPRODUCE WITHOUT PERMISSION.

E N D
Instructional Illustrations & Graphical Devices: Designer’s Intentions & Readers’ Interpretations Elizabeth Boling Kennon Smith Theodore Frick Indiana University Malinda Eccarius University of Nebraska Lincoln c2004 DO NOT REPRODUCE WITHOUT PERMISSION
Illustrations are widely used in textbooks • Illustrations are widely used in instructional materials (Evans, Watson, and Willows,1987; Pettersson, 2002), constituting some 30 – 60% of page space in junior high texts and up to 80% of page space in elementary texts. • Pictorial images have demonstrated potentially beneficial effects in a broad range of settings, and for a variety of types of learning (Anglin, Towers & Levie, 1996).
Graphical devices are used in many of instructional illustrations to extend the meaning of the pictorial image. In some cases the student must interpret the device in the way the designer of the image intended in order to complete a learning task successfully.
Accurate interpretation of instructional illustrations is not a given. • Despite what appears to largely be a cross-cultural ability to recognize objects depicted in pictures (Kennedy, 1994; Sless, 1981), the visual content of an illustration is frequently a vehicle used to communicate a more complex meaning or intention. • Beyond their ability to present a visual representation of a given object, visual illustrations do not constitute a universal language.
Research questions • To what extent do various populations interpret the meaning of simple illustrations including graphical devices consistently with the meaning intended by the designer of the illustrations? • When interpretations are not consistent with the intention of the designer, what are the ways in which respondents interpret the meanings of these illustrations?
Pilot Study • 96 college students at a large Midwestern university completed a paper-based survey containing sixteen illustration items. • For each item, each participant wrote a short (usually one sentence) response, indicating what they believed the illustration to mean. • Based on this pilot study, the images were redrawn for consistency, and a 2nd version of the survey was produced without graphical devices in order to collect comparison data.
Survey items 2 3 4 1 6 7 8 5 10 11 12 9 14 15 16 13
expression (happy, excited) path of prior motion physical change (sick, dead) communication / source of communication
Examples from a Vietnamese text for learning English property of motion (fast) Zwier, L. (2003). English for everyday conversation and activities.
Examples from a Vietnamese text for learning English property of communication (electronic) Zwier, L. (2003). English for everyday conversation and activities.
Examples from a Vietnamese text for learning English communication Expression (dismay, unhappiness) Zwier, L. (2003). English for everyday conversation and activities.
Examples from a Vietnamese text for learning English communication communication motion Zwier, L. (2003). English for everyday conversation and activities.
Examples from a Vietnamese text for learning English motion Zwier, L. (2003). English for everyday conversation and activities.
Examples from a Vietnamese text for learning English motion & path of motion motion Zwier, L. (2003). English for everyday conversation and activities.
Coding There’s a lizard = 0 Dead lizard = 1 There’s a lizard = 0 Dead lizard = 1
Results • People trained on the coding scheme agree very consistently in their coding. • The mean of the Kappa values (simple percentage agreement corrected for chance agreement) is .89, with a standard deviation of .15 • Surveys returned in languages other than English were coded by native speakers of those languages.
Frequency analysis Frequencies for all populations by image, with graphical devices
Frequency analysis Frequencies for all populations by image, without graphical devices
Results of frequency analysis • Graphical devices do make a difference in the way that respondents interpret the illustrations: • Respondents who did not see the devices answered consistently with designers’ intentions infrequently except for the images with redundant cues to meaning (bunny, talking, fast car, looking, sign language) • 2 out of 3 who see the devices match the designer’s intended meaning; 1 out of 5 who do not see the devices match the designer’s intended meaning
Results of frequency analysis • Respondents do not interpret meanings as consistently as designers might want or expect them to: • Only two images are interpreted correctly at 80% or above across populations (no running, verbal communication - two people talking) • 10th graders interpreted 9 of 16 pictures consistently with the designers’ intentions at 80% or above; teachers of the deaf interpreted 8 out of 16 pictures this way • In all other populations fewer than half the pictures are interpreted correctly at 80% or above
Comparative analysis • Because the data violate the homogeneity of variance assumption, standard ANOVA procedures could not be used to compare how different groups responded to any particular image. • Therefore, a z-test procedure was used to compare the frequencies with which groups interpreted given images consistently with the designer’s intention.
z-test comparisons • For each image, we made pairwise comparisons with an overall alpha level of .05 • For each image, four pairwise comparisons were calculated. Therefore, the overall alpha level of .05 was divided by 4, resulting in an alpha of .0125 for each individual comparison. • This process is conservative, and minimizes the probability of committing type 1 errors (finding differences between groups simply by chance).
Sample comparative analysis - item 13 designer’s intended meaning electronic speech -2.431 (nsd) -3.390 (sd) -0.705 (nsd) 3.172 (sd)
Comparative analysis • The greatest number of significant differences were found between the U.S. college students and the Malay college students. • Few differences were found between U.S. college students and U.S. teachers of the deaf and hard of hearing, and few differences were found between U.S. 3rd grade and U.S. 10th grade students. • U.S. college students are more similar in their performance to U.S. 3rd graders than to Malay college students. • The data to date suggest that developmental factors make less difference in interpreting images than do culture and language differences. (In this case, the designer of the images was from the U.S.)
Qualitative analysis U.S. college students – all responses, with and without devices
Qualitative analysis U.S. 3rd graders – all responses, with and without devices
Qualitative analysis • Using the constant comparison method to sort all responses made by US college students, we have identified three major groupings of answers.
Findings Form of the response (all responses)
Findings Interpreting the device (images with devices; answers do no match the designer’s intention)
Findings Interpreting the image (images without devices; answers do no match the designer’s intention)
Findings • Respondents seeing the images without devices are 5 times more likely than those who see the devices to give a descriptive response. The devices make a qualitative difference in the form of the responses. • Respondents whose interpretations do not match those of the designer give interpretations that are related to the devices. They appear to notice and use the devices in making their interpretations rather than ignoring the devices or not noticing them. Designers cannot assume that people will ignore graphical devices that they do not understand.
Limitations of the study • Images are simple and viewed outside the learning context. • Investigators do not have access to the respondents’ reasoning process for giving the answers they do. • Images are not categorized by type, so within-subject analysis is not possible at this time.
Note (02/28/05): An expanded version and double-checked version of this study has been accepted for publication in the Journal of Visual Literacy. Please do not reproduce or circulate data or text from this presentation.