Download
1 / 12

E N D
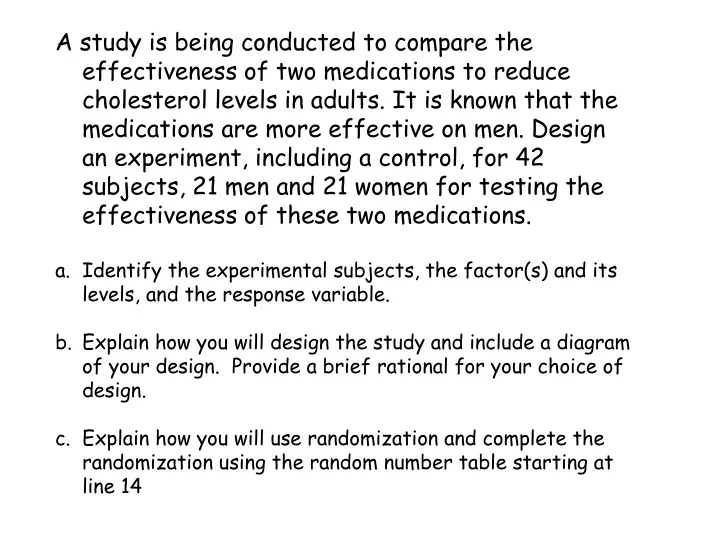
A study is being conducted to compare the effectiveness of two medications to reduce cholesterol levels in adults. It is known that the medications are more effective on men. Design an experiment, including a control, for 42 subjects, 21 men and 21 women for testing the effectiveness of these two medications. • Identify the experimental subjects, the factor(s) and its levels, and the response variable. • Explain how you will design the study and include a diagram of your design. Provide a brief rational for your choice of design. • c. Explain how you will use randomization and complete the randomization using the random number table starting at line 14
A study is being conducted to compare the effectiveness of two medications to reduce cholesterol levels in adults. It is known that the medications are more effective on men. Design an experiment, including a control, for 42 subjects, 21 men and 21 women for testing the effectiveness of these two medications. • Identify the experimental subjects, the factor(s) and its levels, and the response variable. • subjects – 42 adults (21 men & 21 women) • factor(s) – medication • levels – 3 levels (2 different meds & control) • response variable – effectiveness of medications
Explain how you will design the study and include a diagram of your design. Provide a brief rational for your choice of design. • First I would separate the men and women so that I can block for gender. Then I can compare the results for each gender, as well as the whole group. Then I would randomly assign the 21 subjects into three groups. The three levels of treatment would be assigned randomly to the groups. After a period of time I would measure the effectiveness of the drug. The diagram shows the portion for the men’s block. A nearly identical one would be for the women. This experiment should be repeated to ensure that the results are typical. Randomly assign levels of treatment Group 1 (7 men) Apply med. 1 Compare effectiveness 21 men, Randonly assigned Group 2 (7 men) Apply med. 2 Group 1 (7 men) Apply placebo
Explain how you will use randomization and complete the randomization using the random number table starting at line 14 Starting at line 14, I would look at 2 digits at a time for the men, numbered from 01 to 21. The first seven I encounter will form group 1, the second seven I encounter will from group 2. The remaining subjects will form group 3. Then I would roll a number cube to assign each group a treatment. group 1: 14, 07, 02, 15, 13, 18, 20 group 2: 21, 12, 17, 19, 05, 01, 09 group 3: 03, 04, 06, 08, 10, 11, 16 I would then repeat the process starting for women, starting where I ended for men. Remember the 4 principle of Experimental Design: Control, Randomization, Replication and Blocking. This is an example of blocking.)
A new weight loss supplement is to be tested at three different levels (once, twice and three times a day). It is suspected that gender may play a role in weight loss with this supplement. Design an experiment, including a control group for 80 subjects (half of whom are men). Your answer should include a diagram and an explanation. Be sure to include how you will do randomization.This problem is very much like the last one, but there would be 4 groups of 10 men and 4 groups of 10 women. Also there are 4 levels: once a day, twice a day, three times a day and control (none). A placebo would need to be used in order to have a blind experiment.
95% of the sneakers manufactured by a shoe company have no defects. In order to find the 5% that do have defects, inspectors carefully look over every pair of sneakers. Still, the inspectors sometimes make mistakes because 8% of the defective pairs pass inspection and 1% of the good ones fail the inspection. • Incorporate these facts into a tree diagram. • What percent of the pairs of sneakers pass inspection? .9445 • If a pair of sneakers passes inspection, what is the probability that it has a defect? .004/.9445 =.0042 .99 pass No defects . fail .95 .01 .08 pass .05 Defects fail .92 NP .9405 NF .0095 DP .004 DF .046
A researcher suspected a relationship between people’s preferences in movies and their preferences in pizza. A random sample of 100 people produced the following two-way table: • Favorite Movie Pepperoni Veggie Cheese • Zorro 20 5 10 35 • Chicken Little 8 15 12 35 • Dreamer 15 2 13 30 • 43 22 35 100 • a. Fill in the marginal distributions for this table. • b. What percent of these people prefer pepperoni pizza? 43/100 =.43 • c. What percent of people who prefer veggie pizza like Zorro? 5/22=.2272 • What percent of those who like Chicken Little prefer cheese pizza? • 12/35 = .3429
Suppose that 80% of a university’s students favor abolishing evening exams. You ask 10 students chosen at random what their opinion is on this matter. What is the likelihood that all 10 favor abolishing evening exams? • Describe how you would pose this question to 10 students independently of each other. How would you model the procedure? • I would collect a list of all the university’s student id numbers. Then I would use a random number generator to select 10 id numbers and I would interview those 10 students. • Assign digits to represent the answers “Yes” and “No.” I would let 0-7 represent yes and 8-9 will represent no. • Simulate 25 repetitions, starting at line 29 of Table B. What is your estimate of the likelihood of the desired result. • 7, 2, 0, 4, 2, 1, 2, ,2 ,8, 7 this is my 1st trial! 9 students favor. • When I run 25 trials I find that only, all 10 students favor the proposal only 4 out of 25 times, about 16% of the time.
Two 6-sided die are rolled 50 times. • Is this binomial setting? Justify. • This could be a binomial setting depending on what you are looking for in each question since you are performing the experiment 50 times. If there are only 2 options in the outcome you desire, the probability of that outcome doesn’t change and if each roll of two dice is independent. • What is the probability of getting exactly 8 sevens in these 50 rolls • With the Binomial Formula • (50!/(8!*42!))(1/6)^8(5/6)^42 = .1510 • With Calculator • Binompdf(50,1/6,8)=.1510
What is the probability of getting at most 8 sevens in these 50 rolls? • Binomcdf(50,1/6,8)=.5421 • What is the probability of getting no 12’s in 15 rolls of these die? n=15 • P(12)=1/36 • 1-P(all 12s)=1-Binompdf(15,1/36,15)≈0 • 1-(1/12)^15≈0 • What is the probability of getting the first 5 on the 6th roll? P(5)=4/36=1/9 • (8/9)^5(1/9) =Geometpdf(1/9,6)=.0617
Thirty-five percent of all employees in a large corporation are women. If 12 employees are randomly selected, what is the probability that at least 4 of them are women? p=.35, n=12, k=4 P(at least 4 women) =1-P(3 women or less)= 1-Binomcdf(12,.35,3) = .6533
The following shows a cumulative frequency chart for the distribution of scores on a 10-question intelligence test. • Score Number • 0 2 • 1 6 • 2 13 • 3 28 • 4 44 • 5 62 • Score Number • 6 89 • 7 129 • 8 178 • 9 266 • 10 298 • What is the median of the scores? Med = 9 • What is the interquartile range of the scores? Any outliers? Q1=7, Q3=10 IQR = 3, • IQR*1.5 = 4.5, outliers at 0,1,2 • What is the mean of the scores? Mean = 7.93 • Does it appear that the scores are approximately normally distributed? No, there are outliers so the distribution is not symmetric. These outliers pull the mean down from near the median.