Download
1 / 12
140 likes | 269 Vues
Spoiler CFD - Updates. Reviewed By Jaiganesh. Santosh M&S CoE, EIEC, Pune 23 rd June 2011. Objective & CFD Model. Objective: To perform mesh sensitivity study at low velocity To predict drag at different velocities (20 - 50m/s). Taurus. Model set up Wind Tunnel Testing.

E N D
Spoiler CFD - Updates Reviewed By Jaiganesh Santosh M&S CoE, EIEC, Pune 23rd June 2011
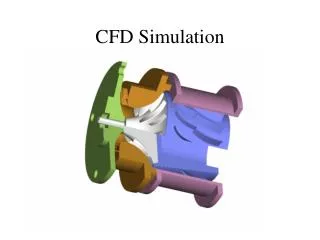
Objective & CFD Model • Objective: • To perform mesh sensitivity study at low velocity • To predict drag at different velocities (20 - 50m/s) Taurus Model set up Wind Tunnel Testing CAD Model used in CFD Taurus model is used to leverage developed CFD methodology on actual car
CFD Domain Actual CFD Domain Boundary Conditions Extended CFD Domain Working fluid : Air @ std atmospheric conditions L Outlet Inlet 2L 5L Inlet is placed 2L distance from the leading edge & Outlet is placed at 5L distance from trailing edge of Car in order to capture wake effects properly
Results Mesh sensitivity Study Drag Prediction at Different velocities After 7M error is < 5%. 7M mesh is finalized for drag prediction of car model without spoiler. CFD results are > 95% agreement with test data
Velocity Vectors 20m/s 40m/s At high velocity more separation observed
Test and CFD Comparison • Variation in test and CFD is < 0.5 N for entire velocity range • Absolute error at low velocity is more as force values at low velocity is less • Possible Reasons for Drag variation at low Velocity: • At low velocity Re is low compared to high velocity. Simulation is carried out by using high turbulence model (k-ω). These turbulence model gives very good results when flow is fully turbulent. At low velocity flow is more viscous near to wall compared to high velocity flow • It is necessary that turbulence specification (turbulent intensity and turbulent length scale) should be appropriate at the boundary while solving CFD (it is recommended that these specification should be come from wind tunnel test)
Summary • 7M mesh is finalized for further studies for car without spoiler • CFD results for drag force over car model without spoiler are > 95% agreement with test data • Key learning: Perform mesh sensitivity at low velocity & Finalize the mesh size for further analysis
Next - Plan • Required : • Test procedure of drag calculation (with picture) and Information about the test calibration curve (How it is generated) • Test data with Repeatability & Reproducibility • Difference between measuring instrument used for Ahmed body and Car model • Information about measurement gauge (accuracy and calibration)
Total Pressure contours 20m/s 40m/s
Static Pressure contours 20m/s 40m/s
Velocity contours 20m/s 40m/s