Download
1 / 21
210 likes | 357 Vues
Analysis of a Local Sales Tax in the City of Milwaukee. Carrie Hoback Michael O’Callaghan Alan Paberzs Allison Schill Samuel Wayne. Prepared for the Budget Office of the Division of Budget and Management (DBM) of the City of Milwaukee. Presentation Outline.

E N D
Analysis of a Local Sales Tax in the City of Milwaukee Carrie Hoback Michael O’Callaghan Alan Paberzs Allison Schill Samuel Wayne Prepared for the Budget Office of the Division of Budget and Management (DBM) of the City of Milwaukee
Presentation Outline • What is Milwaukee’s current fiscal situation? • What are other cities doing? • How will a sales tax affect the economy? • What is the tax incidence of a city sales tax? • Revenue estimates: how much can it raise?
Problem Statement Costs of providing public services are increasing at a faster rate than available revenues creating a “fiscal gap”
Revenue Sources • State Aid (30%) • Revenue receipts declining since 1999 • Projected to decline at rate of inflation • Property taxes (25%) • Political realities limit growth • Projected 2% growth per year after inflation • Other Revenue (User fees, etc.) (45%) • Fees, charges not intended to cover general costs • Projected to grow only at rate of inflation
Expenditures • Cost of maintaining current service levels projected to increase annually at 0.73%, after inflation • Projections • 80% of the City budget is personnel related. • Personnel cost increases 2006-2015: Average difference of Consumer Price Index and Employment Cost Index from 1996-2004.
Milwaukee’s Projected Fiscal Gap Source: Authors’ calculations
Policy Question Is a city sales tax a good way to close the fiscal gap?
What are Other U.S. Cities Doing? • Cities with at least 250,000 residents (67) • 43 of 67 large cities have a city sales tax • Rate ranges from 0.5% to 4% • Most common rate is 1.0% • Most common collection mechanism: • “Piggy-back” approach – state collects all sales tax and sends back portion to city
Geographic Distribution of City Sales Taxes (Pop. Over 250,000) 1.0% or less 1.0-2.0% 2.01% or more
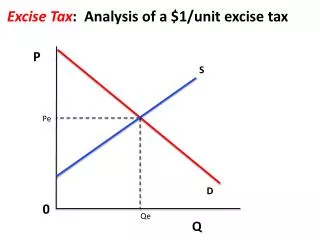
How will a City Sales Tax Affect the Economy? • A local increase in the sales tax might cause people to try to avoid the tax. • Example: Going to suburbs to buy a new TV • Analysis: • Model the expected consumer reactions • Cost of travel • Distances from each city zip code to city shopping centers and suburban alternatives • Determine price at which at which a “cost-minimizing” shopper would leave the city
Results of Lost Sales Model • Assume 50% of residents are “cost-minimizers” • 0.5% Tax 0.47% decline in sales • 0.75% Tax 0.59% decline • 1.0% Tax 0.72% decline • These are similar to academic predictions • Projected declines in sales are modest and should be considered acceptable losses
Return to the Problem: Fiscal Gap • If not solved with sales tax, then what? • We assume that the alternative to a city sales tax is an increase in the property tax
Tax Incidence • Property Tax vs. Sales Tax • Residents and Nonresidents
Tax Incidence on Nonresidents • Property Tax Exporting • Residential, Commercial, Manufacturing, and Personal Property • An estimated 25 percent of property tax is exported • Sales Tax Exporting • Three Mechanisms • Commuters • Visitors • Business purchases borne by nonresidents • An estimated 42 percent of sales tax is exported
Tax Incidence on Residents • Why so important? Milwaukee has higher proportion of low-income residents than the rest of Wisconsin • State of Wisconsin Household Incomes • 27% under $27,500 • 20% over $82,000 • City of Milwaukee Household Incomes • 38% under $27,500 • 12% over $82,000
Tax Incidence: Property vs. Sales(Drawing local conclusions from state data) Source: DOR Tax Incidence Study
Tax Incidence Conclusions • Sales tax is similarly regressive to a property tax • More exporting potential with sales tax
Estimating Sales Tax Revenue for the City of Milwaukee • Choosing a Reasonable Range • 0.50, 0.75, and 1.00% • Forecasting Sales Tax Revenues • Methodology • Milwaukee County Sales Tax Revenues • Consumer Expenditures by Zip Code • Annual Growth in Real Personal Income • Accounting for Economic Competitiveness
Sales Tax Revenue Estimates Source: Authors’ Calculations
Closing the Fiscal Gap Source: Authors’ Calculations
Conclusions • A city sales tax of 0.75% would fill the fiscal gap • Small decrease in total city sales (0.6%) • Larger exporting potential than property tax • Burden on low income residents similar to a property tax