Download
1 / 22
220 likes | 322 Vues
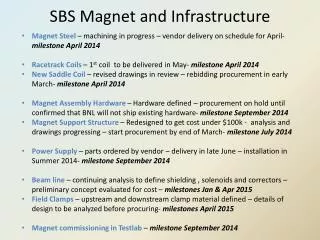
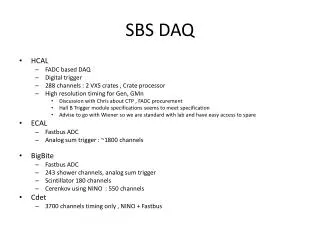
Jorge Ortiz. Metadata Verification and SBS. Outline. Metadata verification Scalable anomaly detection. Chiller. Pump. Zone. Chiller. Vent. Vent. Pump. SF. EF. AHU. System. Chiller. Space. Pump. Zone. Chiller. Vent. Vent. Pump. SF. EF. AHU. Types of relationships.

E N D
Jorge Ortiz Metadata Verification and SBS
Outline • Metadata verification • Scalable anomaly detection
Chiller Pump Zone Chiller Vent Vent Pump SF EF AHU
System Chiller Space Pump Zone Chiller Vent Vent Pump SF EF AHU
Types of relationships • Geometric • Placement, associations • Functional • Temperature,pressure, flow, etc. • Semantic • Electrical device taxonomy • Ownership
Metadata management pipeline Our work Current
Geometric Verification • Are the geometric (spatial) associations correct? • Are all the sensors with the same spatial grouping in the same location? • Sensors can be moved or replaced • Contractor mislabels point in BMS • How can the sensor data guide this process? SODA4R520__ART
Similar Trend in Data Streams • Sensor streams driven by same phenomena • Common trend ineffective at uncovering relationships
No Discernible Correlation Pattern in Raw Traces • Each row/column is a location in the building • Each location has one or more sensors • Cell (i,j) is the average device pairwise correlation between sensors at locations i and j
Empirical mode decomposition • Approach used for finding underlying data trends • Algorithm for decomposing signals in the time domain of non-stationary, non-linear signals • Similar to FFT, PCA but yields characteristic time and frequency scales • Output “Intrinsic mode functions” • Combination of underlying signal in the same time scale
Broader validation Compare the EHP to 674 other sensors: **Suggests Geometric Verification is possible** EMD helps us to discriminate un/related sensors
Functional Verification • Mislabeled “type” information of a data stream • Fault detection • Strip, bind, and search process
Buildings Generate Lots of Data • Difficult for building managers to know where to start to look for problems • Which devices? Locations? Patterns? Time interval? • Key Observation • Devices are used simultaneous in the same way • Typically usage times/patterns are tightly un/coupled • Example: • Lights and HVAC during the day • Basic assumption • Normal usage is efficient. • Pairwise correlation analysis of sensor traces • Uncover usage relationships between devices
Searching for Outliers • Construct reference matrix for each time-reference interval • For new data points, compute l • Identifying outliers • Median Absolute Deviation p=4 , b=1.4826
Results • High power usage • Alarms corresponding to electricity waste • Lower power usage • Alarms representing abnormal low electricity consumption • Punctual • Short increase/decrease in electricity consumption • Missing data • Possible sensor failure • Other • unknown
Alarms in Eng. Bldg 2 @Todai AC On All Night AC Not On During Office Hours Lights On All Night
Alarms in Cory Hall Change in power usage pattern Possible Chiller dysfunction Normal 18 days, 2500 kWh Simultaneous heating and cooling
Impact • 2 research papers in collaboration with U. of Tokyo • Internet of Thing Workshop @IPSN 2012 • IPSN 2013 (April) • Web tool that finds anomalies from data uploads • Upcoming release
Future Work • Value verification • Model-based verification, model validation • Standard representation with embedded confidence parameters for MPC