Download
1 / 23
230 likes | 319 Vues
658A Carbon Cycle and Climate Past, Present and Futur e. Combination of mechanisms responsible for the missing carbon sink using bottom-up approach. Haifeng Qian March 29, 2006. Outline. Brief background of carbon cycle and “missing carbon” Concerns to be addressed Literary reviews

E N D
658A Carbon Cycle and Climate Past, Present and Future Combination of mechanisms responsible for the missing carbon sink using bottom-up approach Haifeng Qian March 29, 2006
Outline • Brief background of carbon cycle and “missing carbon” • Concerns to be addressed • Literary reviews • Progress and challenge on bottom-up approach • Conclusion and discussion
“Missing carbon” in the carbon cycle balances (1980’s) Emission + Land-use = Terrestrial + Ocean + Atmosphere 5.4 1.7 (*) 1.9 (*) 2.0 3.2 *: more uncertain
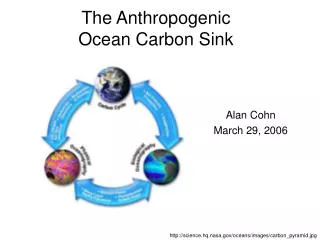
“missing carbon” • History of “missing sink”: coined by ocean modelers (1970’s) of the carbon cycle who were unable to account for all the carbon released to the atmosphere from fossil fuel burning and land-use changes in oceanic sinks, but were uncomfortable attributing the unaccountable carbon to a terrestrial sink, without having a detailed model to explain terrestrial biosphere carbon storage mechanisms. • During the past two decades, a substantial fraction of the carbon sink has been on land, in the temperate and boreal latitudes of the Northern Hemisphere the mechanisms and the detailed spatial pattern of this Northern Hemisphere terrestrial sink remain elusive. • Quantifying these sinks and understanding the underlying mechanisms are top priorities for understanding Earth's major biogeochemical cycles and for establishing how changes in their magnitude could affect the future trajectory of atmospheric CO2 concentration.
Schindler, David S. “The Mysterious Missing Sink.” Nature. March 1999
Questions: • What is debate of missing carbon sinks • Why is missing carbon sinks important • Modeling approaches for this “ missing” carbon • Mechanisms responsible for “missing” carbon • Progress and challenge of bottom-up approach • Perspectives of future carbon
Top-down Bottom-up Most important advantage of bottom-up approach is that can give the estimates based on the mechanistic hypotheses about the processes that control the fluxes
Possible mechanisms for missing carbon • Rising temperatures, atmospheric CO2 concentrations, and nitrogen deposition, • Climate change • Land use • Forest regrowth • Fire suppression
The Not-So-Big US Carbon Sink ... • There is a sink for carbon of about 2 Pg/year north of approximately 30°N, although these analyses were unable to constrain the longitudinal distribution of the sink. • Fan et al.(science 1998) suggest on the basis of atmospheric and oceanic data and modeling that the Northern Hemisphere carbon sink is predominantly North American, south of 51ºN, with a magnitude about that of U.S. fossil fuel emissions. • Fung et al(science 1999):U.S. ecosystems accumulated carbon at a rate of 0.15 to 0.35 PgC/yr, equivalent to about 10 to 30% of U.S. fossil fuel emissions. • The apparent contrast between the conclusions of these two studies highlights the differences between and uncertainties associated with atmospheric "top-down" and terrestrial ecosystem "bottom-up" approaches.
Mechanism 1: Rising temperatures, elevated atmospheric CO2 concentrations, and nitrogen deposition , and climate change Greeness? NDVI increase (1982-1990) Myneni et al. 97 nature
Fertilization mechanism is not all: • Elevated CO2 concentrations and nitrogen deposition stimulate plant growth in many ecosystems However, Long-term observation suggests such CO2 fertilization effects are too small to explain.
Experiments (DUKE)with elevated co2 concentration show a rapid decrease of the fertilization effect after an initial enhancement. • Soil fertility limits carbon sequestration by forest ecosystems in CO2-enrich atmosphere Ram Oren: 2001, Nature 411
Caspersen et al. science 290 Contributions of Land-Use History to Carbon Accumulation in U.S. Forests B(1) = B(0) + G(0) –μB(0) Forest enhance << forest regrowth (land use) • Land use is the dominant factor governing the rate of carbon accumulation in these states, with growth enhancement contributing far less than previously reported. • The estimated fraction of aboveground net ecosystem production due to growth enhancement is 2.064.4%, with the remainder due • to land use.
Mcguire 2001: Analysis of co2, climate and land use effect with four process-based ecosystem model Cumulative net carbon storage
Consider effect of increasing co2, climate change and cropland establishment and abandonment Net lease associated with cropland establishment and abandonment
Predicting the future source Sink ? Narrow or better understanding
IPSL UMD Hadley UMD work: These results suggest that different CO2 fertilization strengths explain part of the UMD-IPSL differences and soil decomposition and turnover time explain partly the UMD-Hadley differences in the coupled runs. Zeng: GRL 2004
Mechanism 2: re-growth The ecosystem recovery processes that are primarily responsible for the contemporary U.S. carbon sink will slow over the next century, resulting in a significant reduction of the sink. Hurtt: PNAS,2002
Mechanism 3:fire suppression US) Fig. 2. Estimated average annual air-to-ground net flux in Pg C/y from 1700 to 1990. Positive values indicate a land sink and negative values indicate a source to the atmosphere. Light line, Houghton estimate(1999 science) without fire suppression. Dark line, Houghton estimate with fire suppression. Dark line with ■ED (Ecosystem Demography model). Hurtt: PNAS,2002
Conclusion and discussion • “ Missing” Carbon still not well known • Progress made but challenge big • Mechanisms in bottom-up approach • No magic bullets to avoid higher co2 concentration in the next century • Better understanding of carbon cycle is indeed needed
Reference • Sarmiento, J.L. and N. Gruber. Sinks for anthropogenic carbon, Physics Today, 55(8), 30-36, 2002. • J. P. Caspersen et al., Science 290, 1148 (2000). • W. H. Schlesinger, J. Lichter, Nature 411, 466 (2001). • S. W. Pacala et al., Science 292, 2316 (2001). • G. C. Hurtt et al., Proc. Natl. Acad. Sci. USA 99, 1389 (2002). • Zeng et al . GRL, 2004, 31 L20203 • Christopher B. F et al .Science 1999. 544 – 545 • Mcguire et al. GBC, 2001 ,15,183