Download
1 / 20
200 likes | 214 Vues
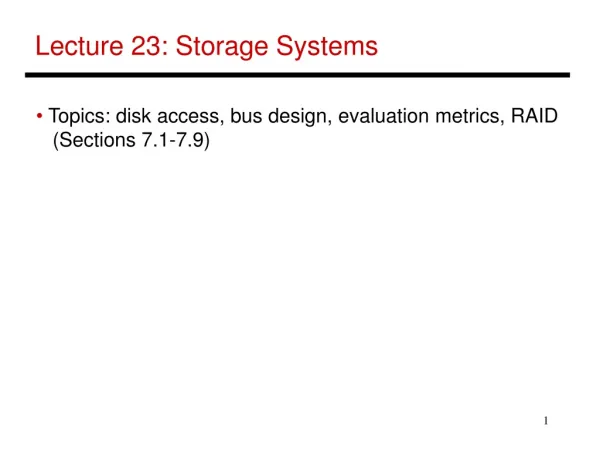
Lecture 21: Storage Systems. Disk insides, characteristics, performance, reliability, technology trends, RAID systems. Adapted from UCB CS252 S01, Revised by Zhao Zhang. I/O Systems. interrupts. Processor. Cache. Memory - I/O Bus. Main Memory. I/O Controller. I/O Controller. I/O

E N D
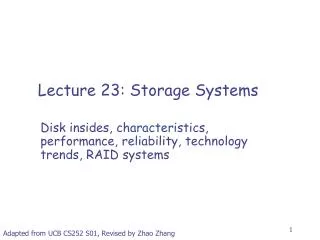
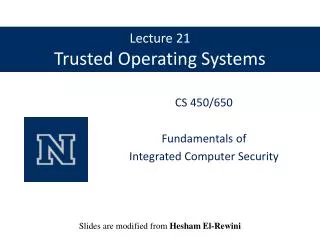
Lecture 21: Storage Systems Disk insides, characteristics, performance, reliability, technology trends, RAID systems Adapted from UCB CS252 S01, Revised by Zhao Zhang
I/O Systems interrupts Processor Cache Memory - I/O Bus Main Memory I/O Controller I/O Controller I/O Controller Graphics Disk Disk Network
Storage Technology Drivers • Driven by the prevailing computing paradigm • 1950s: migration from batch to on-line processing • 1990s: migration to ubiquitous computing • computers in phones, books, cars, video cameras, … • nationwide fiber optical network with wireless tails • Today: digital media everywhere • Digital forms of voice, picture, and video • Data from scientific computing such as earthquake simulation, high energy physical experiments, bioinformatics • In forms of personal storages, web server, peer-to-peer storage, grid storage • Effects on storage industry: • Embedded storage • smaller, cheaper, more reliable, lower power • Data utilities • high capacity, hierarchically managed storage
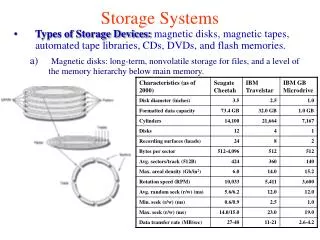
Response time = Queue + Controller + Seek + Rot + Xfer Service time Magnetic Disks Track • Purpose: • Long-term, nonvolatile storage • Large, inexpensive, slow level in the storage hierarchy • Characteristics: • Seek Time (~8 ms avg) • positional latency • rotational latency • Transfer rate • 10-40 MByte/sec • Blocks • Capacity • Gigabytes • Quadruples every 2 years Sector Cylinder Platter Head 7200 RPM = 120 RPS => 8 ms per rev ave rot. latency = 4 ms 128 sectors per track => 0.25 ms per sector 1 KB per sector => 16 MB / s
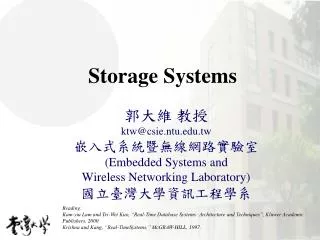
{ Platters (12) Photo of Disk Head, Arm, Actuator Spindle Arm Head Actuator
Seagate Barracuda 180 • 181.6 GB, 3.5 inch disk • 12 platters, 24 surfaces • 24,247 cylinders • 7,200 RPM; (4.2 ms avg. latency) • 7.4/8.2 ms avg. seek (r/w) • 64 to 35 MB/s (internal) • 0.1 ms controller time • 10.3 watts (idle) Track Sector Cylinder Track Buffer Arm Platter Head Latency = Queuing Time + Controller time + Seek Time + Rotation Time + Size / Bandwidth { per access + per byte source: www.seagate.com
Disk Performance Factors Actual disk seek and rotation time depends on the current head position • Seek time: how far is the head to the track? • Disk industry standard: assume random position of the head, e.g., average 8ms seek time • In practice: disk accesses have locality • Rotation time: how far is the head to sector? • Can safely assume ½ of rotation time (disk keeps rotating) • 10000 Revolutions Per Minute 166.67 Rev/sec1 revolution = 1/ 166.67 sec 6.00 ms1/2 rotation (revolution) 3.00 ms • Data Transfer time: What are the rotation speed, disk density, and sectorsper transfer? • 10000 RPM a track of data per 6.00 ms • Outer tracks are longer and may support higher bandwidth
Disk Performance Example • Rule of Thumb: • Observed average seek time is typically about 1/4 to 1/3 of quoted seek time (i.e., 3X-4X faster) • Rule of Thumb: disks deliver about 3/4 of internal media rate (1.3X slower) for data • Calculate time to read 64 KB for UltraStar 72, using 1/3 quoted 7.4ms seek time, 3/4 of 64MB/s internal outer track bandwidth Disk latency = average seek time + average rotational delay + transfer time + controller overhead = (0.33* 7.4 ms) + 0.5 * 1/(7200 RPM/(60000ms/M)) + 64 KB / (0.75 * 65 MB/s) + 0.1 ms = 2.5ms + 0.5 /(7200 RPM/(60000ms/M)) + 64 KB / (47 KB/ms) + 0.1 ms = 2.5 + 4.2 + 1.4+ 0.1 ms = 8.2 ms (64% of 12.7)
Disk Characteristics in 2000 $828 $447 $435
Capacity + 100%/year (2X / 1.0 yrs) Transfer rate (BW) + 40%/year (2X / 2.0 yrs) Rotation + Seek time – 8%/ year (1/2 in 10 yrs) MB/$ > 100%/year (2X / 1.0 yrs) Fewer chips + areal density Seagate 120GB Internal Hard Drive ST3120026A, $150 at staple (list price) Maxtor 120GB 8MB Cache Hard Drive $59.84 after rebate at OfficeDepot Disk Performance/Cost Trends IBM Microdrive
Response Time (ms) 300 200 100 0 0% Throughput (% total BW) Queue Proc IOC Device Disk System Performance • System-level Metrics: • Response Time • Throughput • Response time= Queue + Controller + service time (√) 100% Response time = Queue + Device Service time
Arrivals Departures How About Queuing Time? • Queuing time can be the most significant one in disk response time • More interested in long term, steady state than in startup => Arrivals = Departures • Little’s Law: Mean number tasks in system = arrival rate x mean reponse time • Applies to any system in equilibrium, as long as nothing in black box is creating or destroying tasks
System server Queue Proc IOC Device A Little Queuing Theory: Notation • Queuing models assume state of equilibrium: input rate = output rate • Notation: r average number of arriving customers/secondTser average time to service a customer (tradtionally µ = 1/ Tser)u server utilization (0..1): u = r x Tser (or u= r / µ)Tq average time/customer in queue =Ts er x u / (1 –u)Tsys average time/customer in system: Tsys = Tq + TserLq average length of queue: Lq = r x Tq Lsys average length of system: Lsys = r x Tsys • Little’s Law: Lengthserver = rate x Timeserver (Mean number customers = arrival rate x mean service time)
A Little Queuing Theory: Example • Processor sends 50 x 8KB disk I/Os per sec, requests & service exponentially distrib., avg. disk service = 12 ms • On average, how is the disk utilized? • What is the number of requests in the queue? • What is the average time a spent in the queue? • What is the average response time for a disk request? • Notation: r average number of arriving customers/second= 50Tser average time to service a customer= 12 msu server utilization (0..1): u = r x Tser= 50/s x .012s = 0.60Tq average time/customer in queue = Ts er x u / (1 – u) = 12x 0.60/(1-0.60) = 12x1.5 = 18 msTsys average time/customer in system: Tsys =Tq +Tser= 30 msLq average length of queue:Lq= r x Tq= 50/s x 0.018s = 0.9 requests in queueLsys average # tasks in system : Lsys = r x Tsys = 50/s x 0.030s = 1.5 Look into textbook when you need to work on I/O
How to build Large Storage: Disk Array Array Controller String Controller . . . String Controller . . . String Controller . . . String Controller . . . String Controller . . . String Controller . . . Not practical to build large disks
Array Reliability • Reliability of N disks = Reliability of 1 Disk ÷ N • 50,000 Hours ÷ 70 disks = 700 hours • Disk system MTTF: Drops from 6 years to 1 month! • (MTTF: Mean Time to Failure) • • Arrays (without redundancy) too unreliable to be useful! • Solution: RAID -- Redundant Arrays of Inexpensive Disks
10010011 11001101 10010011 . . . P 1 0 0 1 0 0 1 1 1 1 0 0 1 1 0 1 1 0 0 1 0 0 1 1 1 1 0 0 1 1 0 1 logical record Striped physical records If disk fails, subtract P from sum of other disks to find missing information RAID: The Idea P contains sum ofother disks per stripe mod 2 (“parity”) RAID-3 shown
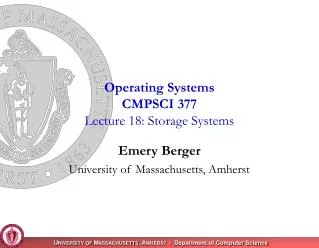
Stripe RAID 4: High I/O Rate Parity Increasing Logical Disk Address D0 D1 D2 D3 P Insides of 5 disks D7 P D4 D5 D6 D8 D9 D10 P D11 Example: small read D0 & D5, large write D12-D15 D12 D13 P D14 D15 D16 D17 D18 D19 P D20 D21 D22 D23 P . . . . . . . . . . . . . . . Disk Columns
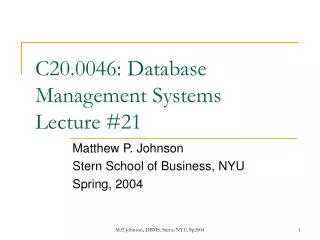
RAID 5: High I/O Rate Interleaved Parity Increasing Logical Disk Addresses D0 D1 D2 D3 P Independent writes possible because of interleaved parity D4 D5 D6 P D7 D8 D9 P D10 D11 D12 P D13 D14 D15 Example: write to D0, D5 uses disks 0, 1, 3, 4 P D16 D17 D18 D19 No diskhot spot! D20 D21 D22 D23 P . . . . . . . . . . . . . . . Disk Columns
Future Storage Trends • Disks: • Extraodinary advance in capacity/drive, $/GB • Currently 17 Gbit/sq. inch; can continue past 100 Gbit/sq. inch? • Bandwidth, seek time not keeping up: 3.5 inch form factor makes sense? 2.5 inch form factor in near future? 1.0 inch form factor in long term? • Tapes • Old technique, no investment in innovation • Are they already dead? • What is a tapeless backup system? • Other Storage • CD/DVD • Compact Flash, USB key storage, MRAM