Download

1 / 22
220 likes | 230 Vues
This study compares temperature profiles in the Southern Adriatic using high-resolution measurements from 2003 and 2006. The study finds colder conditions on the west side due to a flow of colder deep water from the north, while warmer conditions on the east side are caused by the flow of LIW through the Otranto Strait. The 2006 data shows slightly colder temperatures compared to 2003. Near real-time observations can improve oceanographic forecasting.

E N D
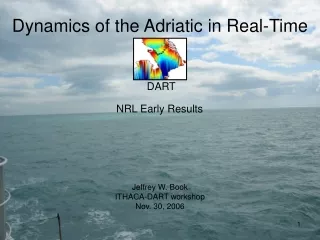
1.2.2.XBT measurements in the Southern Adriatic Mira Morović, Vlado Dadić, Frano Matić, Branka Grbec, Stipe Muslim Institute of Oceanography and Fisheries, Split, Croatia
Dubrovnik-Bari route • Transects December 2002
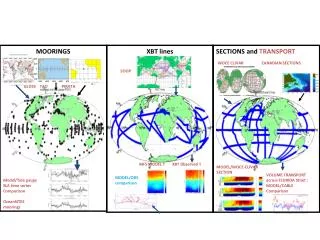
Conclusions • Obtained are high resolution temperature profiles, more stations than in 2003 • The layers bellow 50m to the bottom at the west side have been as usually colder than the same layers at the east side. • The conditions at the west side are caused by a flow of colder deep water from the north.. • The warmer conditions on the east side of the south Adriatic transect are caused by the flow of LIW through the Otranto Strait. • The waters of the south Adriatic transect in the year 2006 have been slightly colder than in the year 2003 which was, according to meteorological data an exceptional year, with especially warmer summer, but colder winter. • Near real time observation can inprove oceanographic forecasting
Air temperature daily mean course from the ship meteorological station and coastal meteorological stations. Air temperature from shipborn meteorological station and sea temperature from XBT measurements during the last XBT campaign in October.
Time table: • Techno-El meteo station on the ferry MARCO POLO • Meteo station received: April 15, 2006 • Request to Jadrolinija for permission for mounting the station : April 22, 2006 • Permission received: July 12, 2006. • Mounting of the Techno-El meteo station: • July 23, 2006 from 10 to 17h30’ • Place: Port of Bari • Mr Montani from Techno El comp.
Meteo-station components: • Campbell logger CR1000 with accumulator and power supplay • Satellite modem • Time interval: 10 seconds • Sensors: • Air temperature, • Air humidity • Air pressure
Meteo station manual Meteo station assembling
Satellite modem Campbell CR1000 logger Voltage regulator Rechargable battery Main switch regulator
Globstar antenna Temperature & Pressure sensors Box with logger
Missing components: • Sensors: • wind speed • wind direction. • GPS system for registration position of ferry • Original Campbell comunication software • Licence for GLOBSTAR communication (for receiving real / near-real time data)
Reconstruction of ferry Marko Polo position: • Monday 20h – Tuesday 17h • (Rijeka-Split (630h)-Dubrovnik route) • Tuesday 23h – Wednesday 7h (Dubrovnik - Bari trensect) • Wednesday 22h – Thursday 7 h (Bari – Dubrovnik transect) • Thursday 20h – Friday 17h (Dubrovnik-Split (630h)-Rijeka route)
Data processing • Data validation • (the procedure developed in EACE project) • 2. Data comparison with regular meteorological stations • (Dubrovnik, Lastovo, Palagruza, Bari, etc.) • Use of the standard procedure for processing of meteo parameters • Processing and comparison of data values along the transect at the predefined interval
QUESTIONS • Position of meteo-station on board: • Is it the most appropriate? (Shadow, albedo) • Have we followed all the procedures for automatic meteo stations on board? • Adjustment of measuring interval (10” now)
PRELIMINARY RESULTS Data dowloaded from station for the period: September 4 – September 8 Bari-Dubrovnik Dubrovnik-Bari
Measuring values of AT,AP and AH September 4, 23-24h