Download
1 / 1
10 likes | 141 Vues
The reliability table expresses how reliable the answer of each SOM is. Using the definition of conditional probability and the multiplication rule, we define the probability of pattern p belonging to class C given that feature map f has responded C for input p as:. (1).

E N D
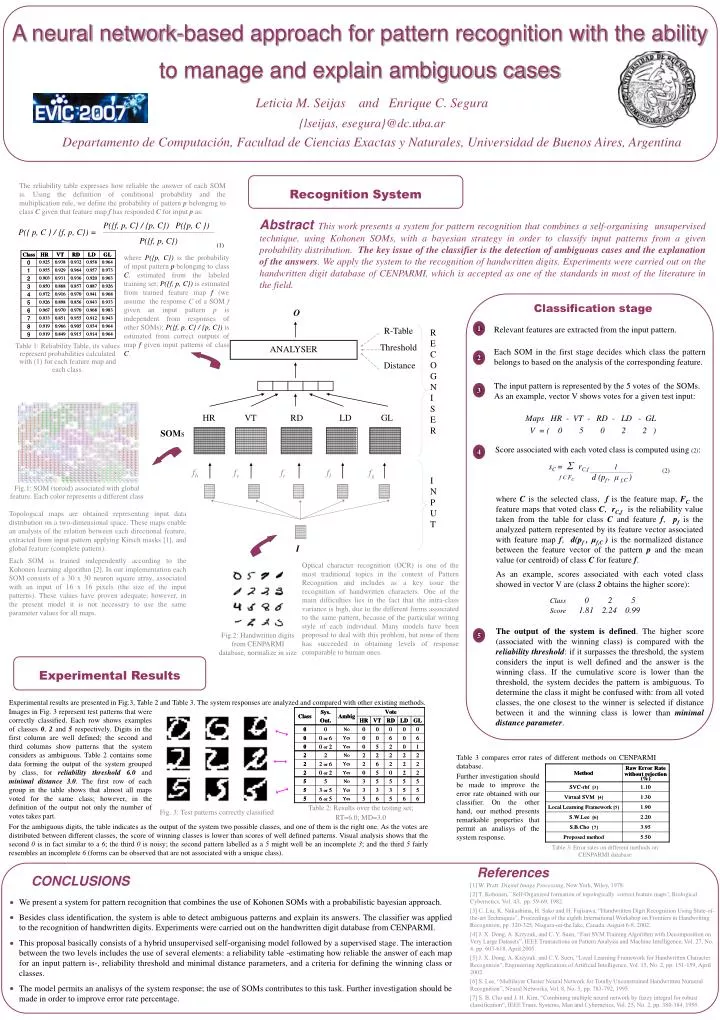
The reliability table expresses how reliable the answer of each SOM is. Using the definition of conditional probability and the multiplication rule, we define the probability of pattern p belonging to class C given that feature map f has responded C for input p as: (1) where P({p, C}) is the probability of input pattern p belonging to class C, estimated from the labeled training set; P({f, p, C}) is estimated from trained feature map f (we assume the response C of a SOM f given an input pattern p is independent from responses of other SOMs); P({f, p, C} / {p, C}) is estimated from correct outputs of map f given input patterns of class C. P({f, p, C} / {p, C}) P({p, C }) P({ p, C } / {f, p, C}) = P({f, p, C}) Experimental Results Recognition System Classification stage 1 Relevant features are extracted from the input pattern. Table 1: Reliability Table, its values represent probabilities calculated with (1) for each feature map and each class. Each SOM in the first stage decides which class the pattern belongs to based on the analysis of the corresponding feature. 2 The input pattern is represented by the 5 votes of the SOMs. As an example, vector V shows votes for a given test input: 3 Maps HR - VT - RD - LD - GL V = ( 0 5 0 2 2 ) Score associated with each voted class is computed using (2): 4 sC =Σ rC,f1 (2) d (pf , μf,C ) f Є FC Fig.1: SOM (toroid) associated with global feature. Each color represents a different class where C is the selected class, f is the feature map, FC the feature maps that voted class C, rC,f is the reliability value taken from the table for class C and feature f, pf is the analyzed pattern represented by its feature vector associated with feature map f, d(pf , μf,C ) is the normalized distance between the feature vector of the pattern p and the mean value (or centroid) of class C for feature f. As an example, scores associated with each voted class showed in vector V are (class 2 obtains the higher score): Class 0 2 5 Score 1.81 2.24 0.99 The output of the system is defined. The higher score (associated with the winning class) is compared with the reliability threshold: if it surpasses the threshold, the system considers the input is well defined and the answer is the winning class. If the cumulative score is lower than the threshold, the system decides the pattern is ambiguous. To determine the class it might be confused with: from all voted classes, the one closest to the winner is selected if distance between it and the winning class is lower than minimal distance parameter. 5 Fig.2: Handwritten digits from CENPARMI database, normalize in size Images in Fig. 3 represent test patterns that were correctly classified. Each row shows examples of classes 0, 2 and 5 respectively. Digits in the first column are well defined; the second and third columns show patterns that the system considers as ambiguous. Table 2 contains some data forming the output of the system grouped by class, for reliability threshold 6.0 and minimal distance 3.0. The first row of each group in the table shows that almost all maps voted for the same class; however, in the definition of the output not only the number of votes takes part. Table 3 compares error rates of different methods on CENPARMI database. Further investigation should be made to improve the error rate obtained with our classifier. On the other hand, our method presents remarkable properties that permit an analisys of the system response. For the ambiguous digits, the table indicates as the output of the system two possible classes, and one of them is the right one. As the votes are distributed between different classes, the score of winning classes is lower than scores of well defined patterns. Visual analysis shows that the second 0 is in fact similar to a 6; the third 0 is noisy; the second pattern labelled as a 5 might well be an incomplete 3; and the third 5 fairly resembles an incomplete 6 (forms can be observed that are not associated with a unique class). CONCLUSIONS We present a system for pattern recognition that combines the use of Kohonen SOMs with a probabilistic bayesian approach. Besides class identification, the system is able to detect ambiguous patterns and explain its answers. The classifier was applied to the recognition of handwritten digits. Experiments were carried out on the handwritten digit database from CENPARMI. This proposal basically consists of a hybrid unsupervised self-organising model followed by a supervised stage. The interaction between the two levels includes the use of several elements: a reliability table -estimating how reliable the answer of each map for an input pattern is-, reliability threshold and minimal distance parameters, and a criteria for defining the winning class or classes. The model permits an analisys of the system response; the use of SOMs contributes to this task. Further investigation should be made in order to improve error rate percentage. A neural network-based approach for pattern recognition with the ability to manage and explain ambiguous cases Leticia M. Seijas and Enrique C. Segura {lseijas, esegura}@dc.uba.ar Departamento de Computación, Facultad de Ciencias Exactas y Naturales, Universidad de Buenos Aires, Argentina Abstract This work presents a system for pattern recognition that combines a self-organising unsupervised technique, using Kohonen SOMs, with a bayesian strategy in order to classify input patterns from a given probability distribution. The key issue of the classifier is the detection of ambiguous cases and the explanation of the answers. We apply the system to the recognition of handwritten digits. Experiments were carried out on the handwritten digit database of CENPARMI, which is accepted as one of the standards in most of the literature in the field. O R-Table. Threshold Distance RECOG NI SER ANALYSER HR VT RD LD GL SOMs fh fv fr fl fg INPUT Topological maps are obtained representing input data distribution on a two-dimensional space. These maps enable an analysis of the relation between each directional feature, extracted from input pattern applying Kirsch masks [1], and global feature (complete pattern). EachSOM is trained independently according to the Kohonen learning algorithm [2]. In our implementation each SOM consists of a 30 x 30 neuron square array, associated with an input of 16 x 16 pixels (the size of the input patterns). These values have proven adequate; however, in the present model it is not necessary to use the same parameter values for all maps. I Optical character recognition (OCR) is one of the most traditional topics in the context of Pattern Recognition and includes as a key issue the recognition of handwritten characters. One of the main difficulties lies in the fact that the intra-class variance is high, due to the different forms associated to the same pattern, because of the particular writing style of each individual. Many models have been proposed to deal with this problem, but none of them has succeeded in obtaining levels of response comparable to human ones. Experimental results are presented in Fig.3, Table 2 and Table 3. The system responses are analyzed and compared with other existing methods. Table 2: Results over the testing set; RT=6.0; MD=3.0 Fig. 3: Test patterns correctly classified Table 3: Error rates on different methods on CENPARMI database References [1] W. Pratt: Digital Image Processing, New York, Wiley, 1978. [2] T. Kohonen,``Self-Organized formation of topologically correct feature maps'', Biological Cybernetics, Vol. 43, pp. 59-69, 1982. [3] C. Liu, K. Nakashima, H. Sako and H. Fujisawa, “Handwritten Digit Recognition Using State-of-the-art Techniques”, Proceedings of the eighth International Workshop on Frontiers in Handwriting Recognition, pp. 320-325, Niagara-on-the lake, Canada. August 6-8, 2002. [4] J. X. Dong, A. Krzyzak, and C. Y. Suen, “Fast SVM Training Algorithm with Decomposition on Very Large Datasets”, IEEE Transactions on Pattern Analysis and Machine Intelligence, Vol. 27, No. 4, pp. 603-618, April 2005. [5] J. X. Dong, A. Krzyzak. and C.Y. Suen, “Local Learning Framework for Handwritten Character Recognition", Engineering Applications of Artificial Intelligence, Vol. 15, No. 2, pp. 151-159, April 2002. [6] S. Lee, “Multilayer Cluster Neural Network for Totally Unconstrained Handwritten Numeral Recognition”, Neural Networks, Vol. 8, No. 5, pp. 783-792, 1995. [7] S. B. Cho and J. H. Kim, “Combining multiple neural network by fuzzy integral for robust classification“, IEEE Trans. Systems, Man and Cybernetics, Vol. 25, No. 2, pp. 380-384, 1995.