Download
1 / 19
190 likes | 330 Vues
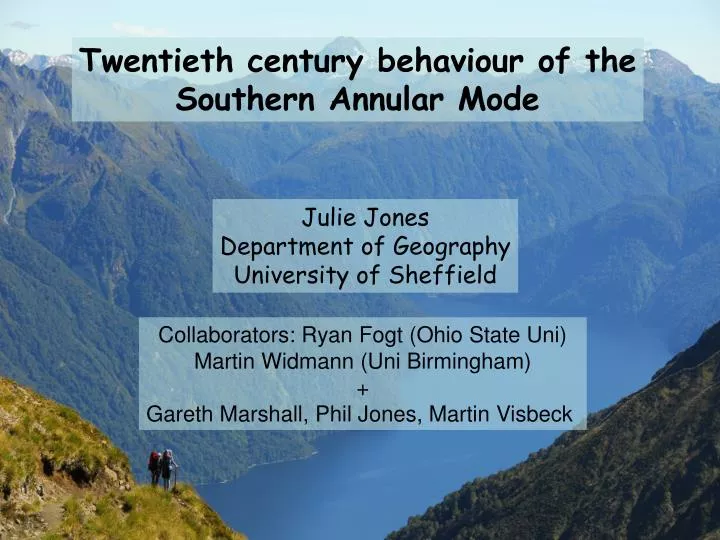
Twentieth century behaviour of the Southern Annular Mode. Julie Jones Department of Geography University of Sheffield. Collaborators: Ryan Fogt (Ohio State Uni) Martin Widmann (Uni Birmingham) + Gareth Marshall, Phil Jones, Martin Visbeck. Twentieth century behaviour of the

E N D
Twentieth century behaviour of the Southern Annular Mode Julie Jones Department of Geography University of Sheffield Collaborators: Ryan Fogt (Ohio State Uni) Martin Widmann (Uni Birmingham) + Gareth Marshall, Phil Jones, Martin Visbeck
Twentieth century behaviour of the Southern Annular Mode • SAM reconstructions for the past century (Jones et al. 2009, J. Clim • Use of these reconstructions to evaluate the SAM in • IPCC AR4 model simulations • (work led by Ryan Fogt, Fogt et al. 2009, J. Clim)
The SAM H Increased meridional pressure gradient H L H Stronger circumpolar westerly winds SAM positive phase Picture: Ryan Fogt stronger, more poleward jet and storm tracks Pattern: commonly defined as first EOF (Empirical Orthogonal Function) of extratropical sea level pressure (SLP) or geopotential height (GPH) Timeseries: commonly defined as principal component (timeseries) of the EOF or normalised zonal mean SLP difference between 40oS and 65oS (Gong and Wang)
? ? SAM trends in recent decades Summer Autumn Strong trends in recent decades in summer (DJF) and autumn (MAM) – linked to stratospheric ozone depletion and to GHG emissions Figure courtesy of R Fogt
To understand the magnitude of past changes in comparison to recent changes, and the influence of forcings on past SAM variability (and how well models capture this) need a reliable record In northern Hemisphere have 100+ year SLP record, in Southern Hemisphere much shorter record Reanalysis data, (1948/58-present) have uncertainties at high latitudes prior to 1979 (before assimilation of satellite data) Marshall (2003) Approximates the SAM index, 1957-present using 6 stations at each latitude Recently Twentieth Century Reanalysis has become available
Century-length SAM reconstructions undertaken using observations of SLP from meteorological stations Determine at which stations SLP is significantly correlated with the SAM index During period when have SAM index, fit statistical model (using principal component regression) between SLP from these stations and the SAM index (and validate this relationship using cross validation) For period when only have station data, use the statistical relationship gained to reconstruct the SAM index 22 stations used in DJF 1905 reconstruction Jones and Widmann 2003 (J. Climate), 2004 (Nature), Jones et al. 2009 (J. Climate)
Seasonal Reconstructions 1865-2005 Jones and Widmann (JW) Predictand: SAM index calculated from ERA40 reanalysis (PC-based) 1958-2001 Four networks – 1865 (DJF and MAM only) - 1905 - 1951 (some island stations become available) - 1958 (a number of Antarctic stations become available) Fogt Predictand: Marshall (2003) SAM index, 1957-2005 Two networks – 1865 (DJF and MAM) - 1905 (JJA and SON) Use different predictands: may influence similarity we can expect Jones, J. M., R. L. Fogt, M. Widmann, G. J. Marshall, P. D. Jones, and M. Visbeck, 2009. Historical Sam Variability. Part 1: Century length seasonal Reconstructions. J. Climate, 22, 5319-5344.
How similar are the predictands? Correlation Marshall/PC = maximum agreement can expect between reconstructions (these are the predictands): weakest agreement in JJA
SLP EOF1 (SAM) ERA40 1979-2001 DJF 45% MAM 33% SON 28% JJA 31% hPa • • the AAOI explains lower % variance of SLP in other seasons • areas of strong SAM signal away from continents on JJA and SON • - fewer and less strongly stations in reconstruction in these seasons
Reconstruction quality: DJF Fogt RE=0.65 JW05 RE=0.70 JW58 RE=0.75 Corrcoef SAMI/SLP Reconstructions with high reduction of error (RE) can be obtained Good agreement: rFogt/JW58= 0.82, rFogt/JW05=0.86; Strong agreement between Marshall index and ERA40 PC, so stations from similar locations selected Similar results in MAM, Fogt RE= 0.50, JW05 = 0.63, JW58=0.78 (more stations from S. America in JW)
Reconstruction quality: JJA JW58 RE=0.61 JW05 RE=0.49 Fogt RE = 0.62 Poorest JW reconstructions in this season rFogt/JW58= 0.72, rFogt/JW05=0.65; Weaker SAM SLP signal over mid-lat land areas – less stations, with weaker relationship to SAM, included Marshall SAM SLP signal stronger over Australia, Indian Ocean and Southern Africa than ERA40, weaker over S. America Similar results in SON – Fogt RE = 0.67, JW05 = 0.52, JW58 = 0.65
Past SAM variability DJF Rjwconcat/fogt = 0.79 • Decadal-scale variability • throughout • Recent positive trend • largest in series • Correlation good • throughout, although • difference in means 9-year hamming filter applied to series, thin lines 95% conf int • Considerable decadal • variability • Peaks in 1890, 1930 • and present • 1930’s peak hemispheric Rjwconcat/fogt = 0.78 MAM
Past SAM variability Rjwconcat/fogt = 0.40 JJA • Low decadal variability • prior to 1960 • Early disagreement • between reconstructions • (Fogt has better • validation statistics) 9-year hamming filter applied to series, thin lines 95% conf int SON Rjwconcat/fogt = 0.82 • No positive recent trend • Higher decadal variability • in early C20 • Disagreement at • beginning • (Fogt better validation..)
But not all SAM periods are ‘SAM-like’ stations ERA40 DJF SLP anomalies 1993-1998 wrt 1979-2001 For periods where SLP anomalies project strongly onto the SAM, but not in all SAM centres of action, with a non-evenly spread station network, events will be captured differently depending on this network DJF 1961 anomalies wrt 1979-2001 Less zonal: so SAM peak less pronounced in ERA40 PC than reconstructions
Results summary: Reconstructions Reconstruction quality JW and Fogt reconstructions of similarly good in DJF and MAM, Fogt has better fitting and validation statistics pre-1958 in JJA and SON What do the reconstructions show? DJF recent trend largest in series Low-frequency variability in DJF and SON and particularly MAM early in reconstructions (prior to strong greenhouse and ozone forcing), Suggesting naturally forced or internal variability, but model simulations (next) indicate that these are outside natural variability Some periods of high/low reconstructed SAM index have very ‘SAM-like’ structure, others less so – periods/reconstructions with sparse station networks means reconstructed SAM index may be over or underestimated in depending on location of pressure anomalies wrt available stations
Model evaluation Now we have these reconstructions, we can use them to evaluate how well the IPCC 4th Assessment Report (AR4) simulations represent the SAM in all four seasons Comparison with 17 coupled atmosphere-ocean GCM simulations, 11 of which employ time-varying ozone forcing Expands on previous studies which were for the recent reanalysis period and for annual values (Miller et al. 2006) or DJF (Cai and Cowan 2007) Fogt, R. L., J. Perlwitz., A. J. Monoghan, D. H. Bromwich, J. M. Jones and G. J. Marshall, 2009: Historical SAM variability. Part II: Twentieth-century variability and trends from reconstructions, Observations, and the IPCC AR4 models. J. Climate, 22, 5356-5365.
30-yr SAM Trends Simulated Reconstructed DJF MAM SON DJF: Recon. and simulated recent trends outside internal variability MAM: sig. -ve reconstructed trends (from 30s peak down), stronger than recent +ve trend (also sig), historical simulated trends outside confidence intervals SON: recons show weak variability, no sig. trends, most ozone models and >1/2 non-ozone models show significant recent trends (JJA not sig in recon or models)
Model spatial SLP trends 1958-2005 Model with strongest +ve trend MAM: observed and simulated trend pattern annular, model amplitude too low observed SON: simulated trend pattern too annular, missing Observed negative trends in SE Pacific – an area of strong ENSO influence in this season
Model Evaluation: Conclusions • Models underestimate the persistence of strong historical SAM anomalies (not shown) • Only in DJF is there a clear anthropogenicaly forced component in the SAM trend (ozone + GHG) • MAM trends may have a forced component, but there are peaks and stronger trends earlier in the reconstruction, these not captured by models • JJA (not shown) both models and reconstructions show no significant trends • The models demonstrate forced trends in SON (which Arblaster and Meehl 2006 find is response to GHG forcing), while observations do not: caution in interpreting model results in this season MAM and SON results indicate perhaps that tropical-extratropical interactions, and/or trop-strat coupling not well resolved by models