Download
1 / 17
180 likes | 208 Vues
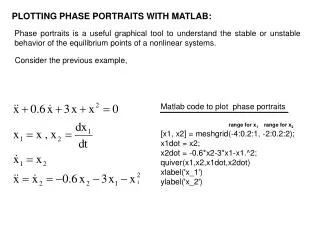
Introduction to MATLAB Plotting LAB 3. Basic Task: Plot the function sin(x) between 0 ≤ x ≤4 π. Create an x-array of 100 samples between 0 and 4 π . Calculate sin(.) of the x-array Plot the y-array. >>x=linspace(0,4*pi,100);. >>y=sin(x);. >>plot(y).

E N D
Basic Task: Plot the function sin(x) between 0≤x≤4π • Create an x-array of 100 samples between 0 and 4π. • Calculate sin(.) of the x-array • Plot the y-array >>x=linspace(0,4*pi,100); >>y=sin(x); >>plot(y)
Plot the function e-x/3sin(x) between 0≤x≤4π • Create an x-array of 100 samples between 0 and 4π. • Calculate sin(.) of the x-array • Calculate e-x/3 of the x-array • Multiply the arrays y and y1 >>x=linspace(0,4*pi,100); >>y=sin(x); >>y1=exp(-x/3); >>y2=y*y1;
Plot the function e-x/3sin(x) between 0≤x≤4π • Multiply the arrays y and y1 correctly • Plot the y2-array >>y2=y.*y1; >>plot(y2)
Display Facilities • plot(.) • stem(.) Example: >>x=linspace(0,4*pi,100); >>y=sin(x); >>plot(y) >>plot(x,y) Example: >>stem(y) >>stem(x,y)
Display Facilities • title(.) • xlabel(.) • ylabel(.) >>title(‘This is the sinus function’) >>xlabel(‘x (secs)’) >>ylabel(‘sin(x)’)
Plot Properties title legend ylabel xlabel
plot(x,y) Plot function where the variables x and y are vector and must be of same size i.e the number of elements should be equal. x=[1 2 3 5 7 7.5 8 10]; y=[2 6.5 7 7 5.5 4 6 8]; plot(x,y)
Plot function plot(x,y,‘line specifiers’,‘PropertyName’,PropertyValue) Line specifiers Line Style Line color Line color Specifier Specifier Specifier solid (default) dashed dotted dash-dot red green blue cyan magenta yellow black white Line specifiers are optional and can be used to define the style and color of the line and the type of markers (if markers are desired). - -- : -. r g b c m y k w
Plot function plot(x,y,‘line specifiers’,‘PropertyName’,PropertyValue) Line specifiers Marker type Marker type Specifier Specifier plus sign circle asterisk point cross triangle (pointed up) triangle (pointed down) square diamond five pointed star six pointed star triangle (pointed left) triangle (pointed right) Line specifiers are optional and can be used to define the style and color of the line and the type of markers (if markers are desired). s d p h < > + o * . ^ v
Stem plot • figure • X = linspace(0,2*pi,50)'; • Y = [cos(X), 0.5*sin(X)]; • stem(Y)
Subplots • x = linspace(0,10); • y1 = sin(x); y2 = sin(2*x); • y3 = sin(4*x);y4 = sin(8*x); • figure • subplot(2,2,1) • plot(x,y1) • title('Subplot 1: sin(x)') • subplot(2,2,2) • plot(x,y2) • title('Subplot 2: sin(2x)') • subplot(2,2,3) • plot(x,y3) • title('Subplot 3: sin(4x)') • subplot(2,2,4) • plot(x,y4) • title('Subplot 4: sin(8x)')
Polar Plot • theta = 0:0.01:2*pi; • rho = sin(2*theta).*cos(2*theta); • figure • polar(theta,rho,'--r')
Plot Matrix: comparison b/w datasets • X = randn(50,3); • plotmatrix(X,'*r')
3D Shaded surface plot: SURF • [X,Y,Z] = peaks(25); • figure • surf(X,Y,Z); • Sphere with two colors
MESH Plot • [X,Y] = meshgrid(-8:.5:8); • R = sqrt(X.^2 + Y.^2) + eps; • Z = sin(R)./R; • figure • mesh(Z)