Download
1 / 79
800 likes | 935 Vues
SMD Data Quality Assessment and Repository Tools Tutorial. November 10, 2007 Catherine Ball Janos Demeter. SMD: Getting Help. Click on the “Help” menu Tool-specific links will be listed at the top. Use the SMD help index to look for specific subjects Send e-mail to:

E N D
SMD Data Quality Assessment and Repository Tools Tutorial November 10, 2007 Catherine Ball Janos Demeter
SMD: Getting Help • Click on the “Help” menu • Tool-specific links will be listed at the top. • Use the SMD help index to look for specific subjects • Send e-mail to: array@genome.stanford.edu
Quality Assessment and Repository Tools Tutorial • Quality Assessment Tools • Ratios on Array • HEEBO/MEEBO plots • Graphing tool • Q-score • Repository • Repository • SVD • Synthetic Gene Tool • kNNimpute
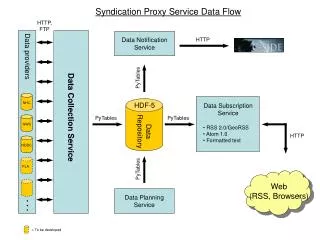
SMD Data Repository Help • How to use the tool • Limitations of file sizes • Sharing data • Options • Links to help for analysis methods, data file formats, data retrieval and clustering
UID is the Unique Identifier for the Spot/Reporter GWEIGHT indicates the weight the Spot/Reporter is given in clustering Values are for each spot/reporter on each array (usually log ratios) NAME sequence label for the Spot/Reporter EWEIGHT indicates the weight the Array/Experiment is given in clustering File Formats: Pre-clustering (PCL) File Names and orders of arrays (if arrays are not clustered)
SMD Data Repository • What is the SMD Data Repository? • What is the repository? • Using the repository to save or upload data • Using the repository to share data • Using the repository to analyze data • Options for PCL files via the repository • View • Data • Delete • Edit • Cluster • Filter • SVD • Synthetic Genes • KNN Impute • Options for CDT files via the repository • GeneXplorer • TreeView • View Clusters, spots
What is the SMD Repository? • A method to save data sets to prevent repeatedly performing the same data retrieval • A method to share processed data with others • A way SMD can provide you with access to new and/or computationally-intensive tools
Uploading files to Repository • If uploading clustered data, enter “CDT” files • If uploading pre-clustering data, enter “PCL” files • Choose an organism • Give a unique name to your data set • Provide a useful description to your data set
Using Your Repository: CDT Deposits • View cluster using GeneXplorer or TreeView • View cluster images • View retrieval and clustering report • Download files • Assign access
Cluster data View information about your repository entry Apply SVD to data Delete the repository entry Using Your Repository: PCL Deposits Apply “Synthetic Genes” to data Edit the entry Filter data Estimate missing data with KNN impute Download data
Using the Repository: CDT File Options CDT files have a few other options GeneXplorer Clustering with Proxy and Spot images TreeView Clustering with Spotimages Clustering with Proxy images
Viewing Repository Entries • Name • Organism • Number of genes • Number of arrays • Size of file • Date uploaded • Description • Data retrieval summary
Downloading Repository Entries Downloading puts file(s) into a folder labeled with your SMD user name onto your computer’s desktop
Deleting Repository Entries • Details about your repository entry • Asks you to confirm before deleting!
Editing Entries -- How to Share! • Change repository entry name • Change description • Add access to repository entry to a GROUP • Add access to a repository entry to a SMD USER
Filtering Data in Repository Entries • If your repository entry is a PCL file, you can re-enter the SMD filtering pipeline
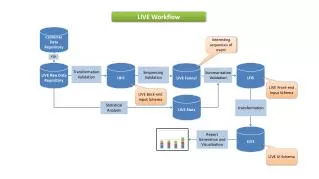
SVD: Singular Value Decomposition • The goal of SVD is to find a set of patterns that describe the greatest amount of variance in a dataset • SVD determines unique orthogonal (or uncorrelated) gene and corresponding array expression patterns (i.e. "eigengenes" and "eigenarrays," respectively) in the data • Patterns might be correlated with biological processes OR might be correlated with technical artifacts
SVD: The Concept (easy version) • Let’s imagine we have a three-dimensional cigar, as shown in A • We can represent this in one dimension, by looking at its lengthwise shadow (B) • Looking at its cross-wise shadow (C), we get an orthogonal view of the cigar that tells us more about the three-dimensional object than B alone.
SVD: Missing Data Estimation • Some algorithms (such as SVD) cannot operate with missing data • You can use this simple method or you can use KNNImpute to estimate missing data
SVD: Raster Display • Each row represents an “eigengene” -- an orthogonal representation of the genes in the dataset • The topmost eigengene contributes the most to the data set
SVD: View Projection • Clicking on a row in the Raster Display brings you the Projection View • You can select genes that have high and low contributions from an eigengene and download them in a PCL file • In this way, you might use SVD to help classify subtypes
SVD: Eigenexpression • Each bar show the probability of expression of each eigengene • You can compare the probabilities to see which eigengenes contribute more to the overall “view” of the data
SVD: Plot selected eigengenes • You can plot as many or as few eigengenes as you like • This plot gives you an easy-to-understand view of the behavior of each eigengene
Synthetic Genes • Purpose: average data based on arbitrary groupings of genes - for biological reasons - for technical reasons • Can average data using: - common genelists - your own genelists • After averaging: - a new row for the synthetic gene data - Original data can be removed/included
Synthetic Genes • Common lists available (only mouse and human data): • Unigene (all clones/oligos that report on a given Unigene id will be averaged and shown as the Unigene id) • LocusLink (same as above, but for LocusLink id) These lists are useful to collapse data by gene, rather than suid/luid. They allow comparison of experiments between different platforms - oligo print to cDNA print or spotted arrays to Agilent arrays where the arrays don’t share common suids. Also can be used to compare cDNA prints with h/meebo arrays These synthetic gene lists are updated on a regular basis.
Synthetic Genes • Other common synthetic gene lists: • chromosome arms • cytobands • 5 Mb tiles based on GoldenPath mappings • Tissue types • tumor types • processes • Additional lists see: http://smd.stanford.edu/help/synthGenes.shtml
Synthetic Genes • You can use your own genelists: • 1 genelist for each synthetic gene • Name of the genelist is the synthetic gene’s name • - tab-delimited text file • File must have header (NAME, WEIGHT) • NAME contains cloneid • WEIGHT can be -1 to 1 (weight of clone • during averaging) • - Can have comment lines (start with #)
Synthetic Genes • Tool only works on pcl files in repository • During data retrieval the ‘include UIDs’ option should not be used • After collapsing, file can be downloaded, added to your repository, and/or clustered • Currently works only for human and mouse data
Synthetic Genes/Merge PCL Files • Related tool: Merge PCL Files • On main page (lists menu -> all programs) under tools section • Can be used to combine 2 pcl files from different sources into a single pcl file. • Cloneids that belong to the same gene can be combined into single row (based on a translation file provided).
Synthetic Genes/Merge PCL Files • Same experiments in the pcl files can be averaged • Averaging method can be mean/median • Translation file: • Tab-delimited text file • First column: desired final identifier • Second column: desired final annotation • Third and subsequent columns: identifiers (first column of a pcl file) in the pcl files that should be collapsed to the identifier in the first column. • Data for identifiers not included in the translation file will not be collapsed
KNNImpute: The Missing Values Problem • Microarrays can have systematic or random missing values • Some algorithms aren’t robust to missing values • Large literature on parameter estimation exists • What’s best to do for microarrays?
Complete data set Data set with 30% entries missing (missing values appear black) Data set with missing values estimated by KNNimpute algorithm Why Estimate Missing Values?
j j 2 | | 5 | 7 | 3 | 1 2 |4.3| 5 | 7 | 3 | 1 Gene X Gene X 2 | 4 | 5 | 7 | 3 | 2 2 | 4 | 5 | 7 | 3 | 2 Gene B Gene B 3 | 5 | 6 | 7 | 3 | 2 3 | 5 | 6 | 7 | 3 | 2 Gene C Gene C KNNimpute Algorithm • Idea: use genes with similar expression profiles to estimate missing values
Clustering: Cluster Image • Scale is indicated on the color bar • Gene names are at the right • Tree generated by hierarchical clustering is at the left
Clustering Display: Clustered Spot Images • Spot images can also be viewed in a clustered image • This can give you a visual impression of the data that are the basis of your analysis
Clustering Display: Adjacent Cluster and Clustered Spot Images
SMD: Getting Help • Click on the “Help” menu • Tool-specific links will be listed at the top. • Use the SMD help index to look for specific subjects • Send e-mail to: array@genome.stanford.edu
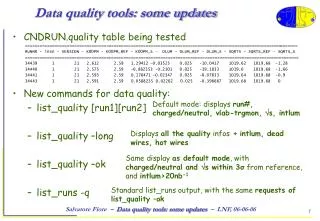
Quality Assessment and Repository Tutorial • Quality assessment tools • Ratios on Array • H/Meebo plots • Graphing tool • Q-score • Repository • Repository • SVD • Synthetic Gene Tool • kNNimpute
Ratios on Array Tool • Accessible from the display data -> view data pages • Ratios on array
Ratios on Array Tool • Quick visualization of log-ratio distribution on the slide • Color assignments are based on log-ratio values and also intensity • Can visualize normalized or non-normalized log-ratios • PLUS: ANOVA analysis to detect spatial bias (print-tip or plate)
Ratios on Array Tool • Not normalized vs. normalized (loess intensity, print-tip)
Ratios on Array Tool • One way ANOVA to test dependence of log-ratios on print-tip and printing plate • F-statistic is given for the hypothesis: no bias in data • In the example, normalization significantly improved print-tip bias