Download
1 / 43
450 likes | 647 Vues
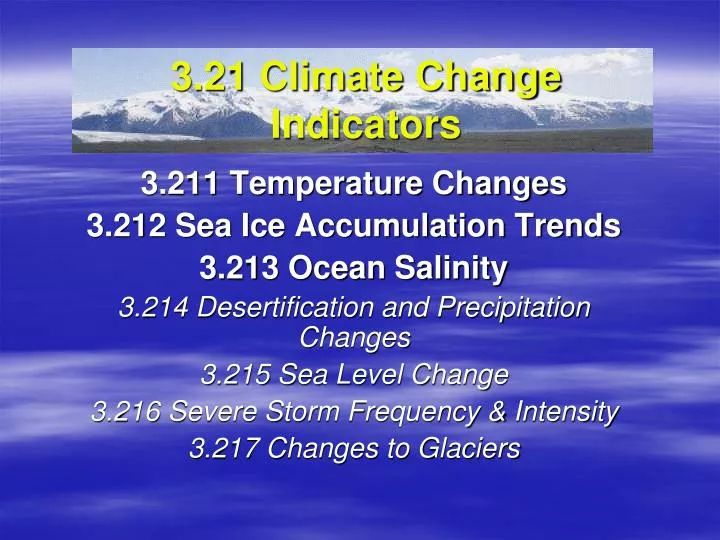
3.21 Climate Change Indicators. 3.211 Temperature Changes 3.212 Sea Ice Accumulation Trends 3.213 Ocean Salinity 3.214 Desertification and Precipitation Changes 3.215 Sea Level Change 3.216 Severe Storm Frequency & Intensity 3.217 Changes to Glaciers. Temperature Changes.

E N D
3.21 Climate ChangeIndicators 3.211 Temperature Changes 3.212 Sea Ice Accumulation Trends 3.213 Ocean Salinity 3.214 Desertification and Precipitation Changes 3.215 Sea Level Change 3.216 Severe Storm Frequency & Intensity 3.217 Changes to Glaciers
Temperature Changes • Since temperature is a significant property used to describe a climate, noting how it changes will provide a quantitative indicator of how the climate is changing. • Temperature records can be gathered from a variety of locations around the globe and have been consistently monitored in some of these locations for many decades
Temperature Changes • Several factors determine the reliability of temperature records as indicators of climate change. • Gathering data from a variety of locations • Different sources (ground, satellite, air) • Ensuring that data sources are accurate • Comparing data in a statistically acceptable manner • Using an appropriate baseline for comparison • Using an appropriate scale
Mean daily temperature change (1901-2000) Environment Canada, 2002
Trends in Canadian Temperature Source: Temperature and Precipitation Trends in Canada During the 20th Century Xuebin Zhang,*Lucie A. Vincent, W.D. Hogg and Ain Niitsoo Climate Research Branch, Meteorological Service of Canada
Not all climate monitoring stations adhere to the guidelines for station credibility
Man's Awareness of Climate Change: Modern Times There is a significant difference between global ground station data and US ground station data.
Different time periods will produce different impressions of temperature changes (Source IPCC 2001)
Ice Accumulation Trends • Satellite photos provide both qualitative and quantitative information about how the climate of an area is changing. • Generally more ice means that the climate is cooling, but also indicates a moderation of seasonal extremes. • Ice will accumulate when summer temperatures are not warm enough to melt away the previous season’s ice. So the winter does not need to be especially cold providing that the summer is cool enough to allow ice to survive into the next winter.
Ice Accumulation trends • Two different types of ice Sea Ice – More sea ice = cooler climate Glacial Ice • Ice can accumulate in warming periods if those periods provide more winter precipitation. • extra accumulation may impact summer temperature by reflecting more sunlight. • the summer temperature will be moderate allowing some ice to survive to the next winter.
Ice Accumulation Trends • Two properties of ice to consider • Ice Area – easily observed from air or satellite photos and compared from one year to another. • Animations & comparisons can show both annual or seasonal changes. • More area MAY suggest cooler temperatures, depending on location of ice • Ice area WILL cause climate to change though. Less ice area increases warming.
Arctic Sea Ice Measurements • Video on arctic ice extent: http://www.youtube.com/watch?v=6j8SGs_gnFk • A record low for sea ice was detected in 2007 Source: National Snow and Ice Data Center http://nsidc.org/sotc/sea_ice.html
Age of Arctic Sea Ice • A study published in 2007 found a dramatic change in the age of sea ice in the central Arctic Basin since the mid-1980s. • In 1987, 57 percent of the ice pack was at least 5 years old, and a quarter of that ice was at least 9 years old. • By 2007, only 7 percent of the ice pack was at least 5 years old, and virtually none of the ice was at least 9 years old. Source: http://nsidc.org/arcticseaicenews/2009/040609.html
Less Older Ice in the Arctic • Ice cover in the Arctic depends in part on ice which survives the summer melt each year. • In 2009, ice older than two years accounted for less than 10% of the ice cover at the end of February. • From 1981 through 2000, such older ice made up an average of 30% of the total sea ice cover at this time of the year. • Younger ice is thinner ice and is prone to melting during the summer months. Source: National Snow and Ice Data Center, University of Colorado http://nsidc.org/arcticseaicenews/2009/040609.html
The Northwest Passage Opens Source: National Snow and Ice Data Center, University of Colorado http://nsidc.org/sotc/sea_ice.html • An open Northwest Passage is a security concern for Canada. • The Canadian government will need to patrol and put more funding to enforcing our sovereignty in the north. • Video: http://www.youtube.com/watch?v=6j8SGs_gnFk
Ocean Salinity Source: http://www.coas.oregonstate.edu/images/userimages/Educators/SuitcaseLessons/MixturesSolutions/worldoceansalinitymap.jpg
Consequences of decreased Arctic Ocean Salinity • The water in our world's oceans is always moving – pulled by tides, blown by waves, and slowly circulating around the globe by the force of the Great Ocean Conveyor Belt (also called thermohaline circulation). • The Conveyor is powered by differences in water temperature and salinity, and one of its most well known parts, the Gulf Stream, is what gives Europe it's relatively mild climate. • Global warming is expected to increase ocean temperatures and to increase the flow of freshwater into the ocean through precipitation, run-off, and melting of glaciers. • Dilution of the ocean's salinity - from melting Arctic ice, runoff, and/or increased precipitation - could disrupt the Conveyor.
Consequences of Decreased Arctic Ocean Salinity • If the North Atlantic becomes too fresh, its waters would stop sinking and the Conveyor could slow down. • Analyses of ice cores, deep-sea sediment cores, and other geologic evidence have clearly demonstrated the Conveyor has abruptly slowed down or halted many times in Earth's history.
Ice Accumulation Trends • Ice Thickness – harder to determine from air photos but needed to understand changes • measured by ice cores and topographical comparisons • thinning = warming, thickening = cooling
Most of the volume of an average ice berg is below water level. If these melt, they would likely have a negligible impact on sea level. http://www.strategicvalueanalysis.com/images/iceberg.jpg
Ice Accumulation Trends • Calving: Occurs when ice pushes out over water and is not supported by land. • Greenland is contributing an increasing amount of calving icebergs which will contribute to sea level rise • Youtube Video http://images.travelpod.com/users/leahrob/1.1257211976.calving-5-of-9.jpg
Sea Level Changes • Melting of “pack” or ocean ice will be balanced by lost ice volume (most of which is under water) and will NOT cause sea level change • Melting of large portions of continental ice could cause changes in sea level. • Difficult to tell how much as records of past sea level changes are obscured by changes in the “uplift” of the landmasses themselves. • Thermal expansion of ocean likely to cause considerable sea level rise.
Consequences of Rising Sea Levels • Low elevation Island nations such as Tuvalu will disappear entirely forcing their entire populations to become refugees. • Low lying countries such as Bangladesh will be loose large amounts of farmland. • Coastal cities may be prone to flooding by rising water and storm surges
Collapse of Antarctic Ice Shelves • Ice shelves are massive areas of ice extending from land based ice over the ocean. • The Larsen B Ice Shelf in Antarctica collapsed in 2002, but it is not expected to increase sea levels as it was already floating on the ocean • Ted Scambos, PhD, University of Colorado at BoulderHe worked with NASA at the Goddard Space Flight Center, studying Antarctica using satellite data.Now Lead Scientist at National Snow and Ice Data Center (NSIDC). Youtube video: http://www.youtube.com/watch?v=FuM1McioCXc
Severe Storms • Numerous studies in recent years have found no evidence that the number of hurricanes and their northwest Pacific Ocean cousins, typhoons, is increasing because of the rise in global temperatures. • But a new study in the journal Nature found that hurricanes and typhoons have become stronger and longer-lasting over the past 30 years. These increases correlate with a rise in sea surface temperatures. • The duration and strength of hurricanes have increased by about 50 percent over the last three decades, according to study author Kerry Emanuel, a professor of atmospheric science at the Massachusetts Institute of Technology in Cambridge. • Source : National Geographic • http://news.nationalgeographic.com/news/2005/08/0804_050804_hurricanewarming.html
Storms Generate Large Waves • Scientists are now understanding that storms of increasing intensity are creating very long-period ocean waves called "infragravity waves" that travel vast distances to Antarctica. • Recent research has began to look at the relationship between wave action and the destruction of the Antarctic ice shelves. • The combination of warmer temperatures and wave action is thought to be increasing the destruction of ice shelves. • Source: American Geophysical Union : http://www.agu.org/news/press/pr_archives/2010/2010-04.shtml
Retreating Alpine Glaciers • Alpine Glaciers are retreating all over the world • Millions of people depend on glaciers for their drinking water – example – Calgary depends on the Bow River which is fed by melting glaciers • Not all Alpine glaciers are in retreat around the world – a small number in Alaska and Northern British Columbia are growing due to increased precipitation.
Retreat of the Athabasca Glacier Jasper National Park, Alberta Elevation 2.1 km above sea level
Athabasca Glacier Source: Dolan, July 2009
Glacier Position in WWII Source: Dolan, July 2009
Looking up the hill from 1992 marker Source: Dolan, July 2009
Top of the Hill People Source: Dolan, July 2009
Toe of the glacier – July 2009 Source: Dolan, July 2009
Projection for the future Source: Dolan, July 2009
Climate Change in Jasper Source: Dolan, July 2009
Homework • Nelson Science Perspectives • page 378 #1, 2, 3, 4 – To be discussed in class next period.
Indicators of Climate Backup Slides
Köppen’s Climatic Map of CanadaSource: Government of Canada, Natural Resources Canada ET EF Cfb Dfc Dfb Csb Dfa BSk
Constructing Climatographs • the letters along the bottom of the graphs identify the months of the year starting with "J" for January • plot the dot in the middle of the bar for all months then join with a smooth curving line to indicate the temperature conditions (the scale is given at the left in Celcius) • Convention: when using colour this line is usually 'red' • twelve vertical bars which indicate the average monthly amount of precipitation. Use the millimetre (mm) scale to the right to measure the amounts- • Convention: when using colour the bars are usually coloured in 'blue'
Clark 2008 With no sense of scale, ice accumulation only reveals how far down the valley this glacier has flowed.
Clark 2008 Looking at the thickness of the ice gives a better idea of how “healthy” a glacier is. (Notice the people in the foreground for scale) But this is still only one part of the picture!