Download
1 / 49
490 likes | 667 Vues
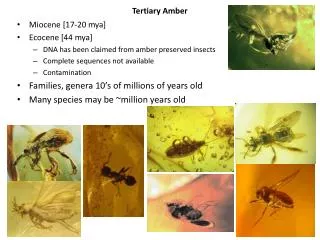
AMBER. Areal Mean Basin Estimated Rainfall COMAP Symposium Heavy Precipitation and Flash Floods Robert S. Davis, Pittsburgh WFO. AMBER Overview. All watersheds in county warning area are defined to a Minimum Basin Area (MBA) of 2 mi 2 to show spatial rainfall distribution.

E N D
AMBER Areal Mean Basin Estimated Rainfall COMAP Symposium Heavy Precipitation and Flash Floods Robert S. Davis, Pittsburgh WFO
AMBER Overview • All watersheds in county warning area are defined to a Minimum Basin Area (MBA) of 2 mi2 to show spatial rainfall distribution. • The WSR-88D polar grid (1o by 1 km) is mapped to the defined watersheds. • Average Basin Rainfall (ABR) is computed for each watershed every volume scan. • An hourly ABR rate is determined from the single volume scan (5-6 min.) of ABR.
National Basin Delineation • 30Sep1999 – NWS agrees to fund the AMBER National Basin Delineation project by NSSL for all of the United States. • ArcInfo used to define the watershed boundaries. • USGS 1 arc second (30 m) DEM data supplied by EROS Data Center. • www.nssl.noaa.gov/teams/western/basins
AMBER Watershed Division • All watersheds in the county warning area are divided into hydrologic segments no larger than 10 mi2. • A Minimum Basin Area of 2 mi2 is used in the initial NSSL stream creation procedure. • Each forecast office may modify the NSSL stream database (subdivide or aggregate).
Patchel Run Allegheny River Rocky Grove French Creek Franklin River Gage Franklin Airport Allegheny River 0 2km
Patchel Run A 5624 French Creek Rocky Grove 62mm 5623 5632 65mm Franklin Franklin 60mm B Franklin Airport 5622 C 61mm Allegheny River 5618 0 2km 42mm
5662 5663 Patchel Run(1) Patchel Run(2) 31mm 35mm 5661 48mm Patchel Run French Creek Allegheny River Rocky Grove 5632 60mm
ABR vs FFG Determining the Flash Flood Threat
Flash Flood Guidance (FFG) • ABR in a specific time period (1, 3 hours) to initiate flooding on streams. • Assumes stream at low flow level. • Assumes no rainfall since data cutoff • FFG is the amount of ABR needed to produce threshold runoff (climatic average runoff needed to start flooding of streams)
FF Scale for Flash FloodingABR in inches • FF0 ABR = FFG to < FFG + 0.5 • FF1 ABR = FFG + 0.5 to < FFG + 1.5 • FF2 ABR = FFG + 1.5 to < FFG + 2.5 • FF3 ABR = FFG + 2.5 to < FFG + 3.5 • FF4 ABR = FFG + 3.5 to < FFG + 4.5 • FF5 ABR = FFG + 4.5 to > FFG + 4.5
Graphical Radar Rainfall OHP – One hour rainfall STP – Storm total rainfall THP – Three hour rainfall
Digital Radar Rainfall DPA – Digital Precipitation Array DHR – Digital Hybrid Scan Reflectivity
Digital Rainfall Estimate 2130 – 2135 UTC Rainfall (mm) 4.1 7.5 9.6 7.4 3.6 6.2 9.8 10.4 9.4 5.0 Grid size 1km x 1km
Digital Rainfall Estimate 2130 – 2135 UTC Rainfall (mm) 4.1 7.5 9.6 7.4 3.6 6.2 9.8 10.4 9.4 5.0 Grid size 1km x 1km
Average Basin Rainfall = 7.3 mm 2130 – 2135 UTC Rainfall (mm) 7.3 7.3 7.3 7.3 7.3 7.3 7.3 7.3 7.3 7.3 Grid size 1km x 1km
Average Basin Rainfall = 7.3 mm 2130 – 2135 UTC Rainfall (mm) 4.1 7.5 9.6 7.4 3.6 6.2 9.8 10.4 9.4 5.0 Grid size 1km x 1km
Average Basin Rainfall = 7.3 mm 2130 – 2135 UTC Rainfall (mm) 5.2 9.3 9.3 6.4 6.4 5.2 9.3 9.3 6.4 6.4 Grid size 1km x 1km
History of NWS Digital Rainfall Products • Manually Digitized Radar (MDR:1975-1993) 40 km grid / 1 hour • RADAP-II digital rainfall (1977-1993) 10-12 offices. Polar grid (2o x 2.2 km / 10 min.) • WSR-88D Digital Precipitation Array (DPA:1993-current) 4 km grid - 1 hour • WSR-88D Digital Hybrid Scan Reflectivity (DHR:1999-current) Polar grid: (1o x 1 km / 5 min.)
Digital Precipitation Array (DPA) • Time interval (1 hour) • Data grid size (4 km x 4 km grid = 16 km2) • Rainfall estimates in the WSR-88D polar grid (1o x 2 km) are averaged to produce a single rainfall estimate in each grid box. • Used for RFC Stage 1-3 precipitation estimation and for FFMP(AWIPS Build 5.0)
Digital Hybrid Scan Reflectivity (DHR) • Time interval (5-6 minutes) • Grid size (1 degree x 1 km) • Reflectivity to the nearest 0.5 dBZ
AMBER DHR Grid Assignment Classes • DHR grid is mapped to all defined watershed segments. This allows ABR computation in 5-6 minute time steps. • DHR grid is mapped to all urban areas to compute ABR urban rainfall. • Single 1km DHR bins are assigned to location of all rain gages, allowing gage comparison with radar estimated rainfall.
Patchel Run A 5624 French Creek Rocky Grove 62mm 5623 5632 65mm Franklin Franklin 60mm B Franklin Airport 5622 C 61mm Allegheny River 5618 0 2km 42mm
x x 16.5o 103.5km x 17.5o 103.5km x x French Creek Rocky Grove x x x x x x 5632 Franklin x 17.5o 100.5km x x 16.5o 99.5km 18.5o 100.5km x Franklin Airport 0 2km x
Radar Rainfall Data • Radar provides 3 rainfall measurements, location, time, and quantitative estimate. • Radar grid size determines the minimum basin area (MBA) for ABR computations. • Sample rate determines time interval, but product time interval may be larger. • Z/R relationship determines rainfall estimate. (Sources of error important!!)
Scale of Flash Flood Storms • Thunderstorms producing heavy rainfall (>25 mm hr-1) are small in area and short in time duration. • Cell lifetime generally < 30 minutes. • Areal coverage is Z/R dependent, larger areas with Tropical Z/R, smaller areas with standard convective Z/R.
Davis, R. S., 2001: Flash Flood Forecast and Detection Methods. Severe Convective Storms, Meteor. Monogr., 28, no. 50, Amer. Meteor. Soc., in press.
Davis, R. S., 2001: Flash Flood Forecast and Detection Methods. Severe Convective Storms, Meteor. Monogr., 28, no. 50, Amer. Meteor. Soc., in press.
AMBER Localization Modifications to the NSSL database done at the NWSFO
AMBER Localization • Subdivide defined NSSL watersheds • Add smaller watersheds • Add urban areas • Create rain gage database • Modify FFG for individual streams
French Creek 13th Street Liberty Street Area 2.5km2 MBA 5 km2 Chubb Run 15th Street Route 62 Localization Add small watersheds Route 8 0 1km Franklin Airport
Localization Add urban areas. Oak Hill 442 m French Creek Rocky Grove 5632 Galena Hill 460m Franklin Franklin Airport 0 2km
Galena Hill 460 m Modify FFG for urbanization 450 m 400 m 15th Street & Liberty Street River Bank 350 m Franklin 300 m 0 0.5 1.0 1.5 km
450 m Modify FFG for steep terrain Oak Hill 445 m 400 m River Bank Atlantic St. Pacific St. Grant St. 350 m 300 m Rocky Grove 0 0.5 1.0 km
Rain Gage Verification of Z/R • Include all rain gages in AMBER database • Latitude/Longitude of gage only needed. • Single DHR bin with gage used for WSR-88D rainfall estimate.
AMBERGIS Graphic Products • ABR Rate Time Lapse • 30 minute ABR Time Lapse • 120 minute ABR Total • Graphics produced for 15, 30, 60, 90, 120 and 180 minutes. (User selectable). • ABR/ABR Rate line graphs.
AMBER Summary • ABR provides basin specific rainfall to determine flash flood risk (ABR-FFG) • ABR rate focuses forecaster attention on critical streams before flooding occurs. • History of ABR helpful in adjusting FFG for multiple rainfall events. • Basin specific ABR allows forecaster to mention “threat area” in warning text.
Flood Damage Path Stream Specific Warnings
Route 322 French Creek 3rd Ward Route 322 5632 15th St Chubb Run Route 8 Route 62 Franklin Airport 0 2km
AMBER Data Sources • ArcView and the spatial analyst extension. www.esri.com • USGS Data (3 arc second DEM data) edcwww.cr.usgs.gov • EPA Data (RF3 data files) www.epa.gov/OST/BASINS/gisdata.html • Ami Arthur aarthur@enterprise.nssl.noaa.gov • Paul.Jendrowski@noaa.gov (SOO KHNL)
buff.ppt 13Jul96 epgh99.ppt 18May99 pitcairn.ppt 01Jul97 zion.ppt 27Jul98 ohio98.ppt 26Jun98 redbank.ppt 19Jul96 dallas95.ppt 05May95 ftc97.ppt 28Jul97 kc1998.ppt 05Oct98 Buffalo Creek, CO Pittsburgh, PA Pittsburgh, PA Cedar City, UT Eastern Ohio Brookville, PA* Dallas, TX* Fort Collins, CO* Kansas City, MO* * Tropical Z/R Cases AMBER Case Studieson COMET Website