Download
1 / 27
270 likes | 417 Vues
Shaping migration policies for economic recovery Rainer M ü nz. Seminar: Tracking migration trends in Europe during recession and recovery. “ Migration Trends, Demographic Outlook and the Need for Smart Migration Policies ”. Rainer Münz Erste Group Bank AG, Head of Research & Development

E N D
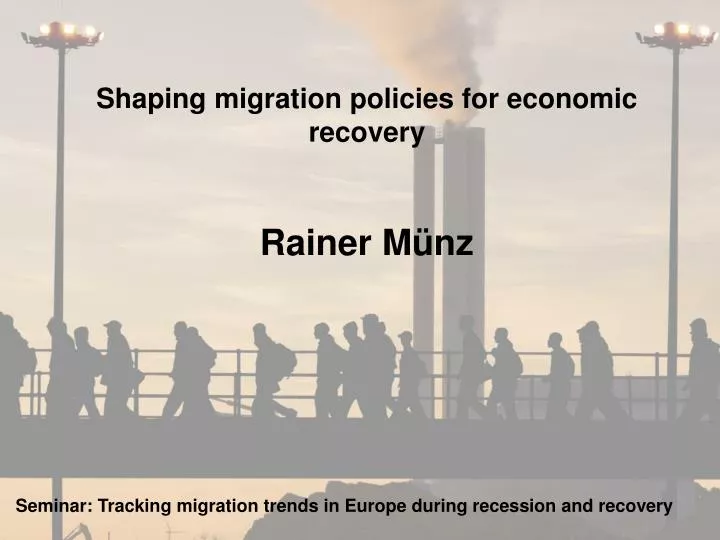
Shaping migration policies for economic recovery Rainer Münz Seminar: Tracking migration trends in Europe during recession and recovery
“Migration Trends, Demographic Outlook and the Need for Smart Migration Policies” Rainer Münz Erste Group Bank AG, Head of Research & Development Policy Network Seminar “In or Out ? Tracking migration trends in Europe during the recession and recovery” London, July 7, 2009
Europe: From Emigration to Immigration,1950-1960(annual net migration rate per 1000 inhabitants) below -5 . -5 to -2 -2 to 0 0 to +2 +2 to +5 over +5 Source:Eurostat, UN Quelle: UN Population Division 2000; Darstellung: Humboldt-Universität Berlin
Europe: From Emigration to Immigration,1990-2000(annual net migration rate per 1000 inhabitants) below -5 . -5 to -2 -2 to 0 0 to +2 +2 to +5 over +5 Quelle:Eurostat, UN Quelle: UN Population Division 2000; Darstellung: Humboldt-Universität Berlin
Europe: From Emigration to Immigration, 2000-2007(annual net migration rate per 1000 inhabitants) below -5 . -5 to -2 -2 to 0 0 to +2 +2 to +5 over +5 Source:Eurostat, UN Quelle: UN Population Division 2000; Darstellung: Humboldt-Universität Berlin
EU27: Immigration Minus Emigration, 1960-2007 (annual abs. numbers) Quelle: Eurostat
… But the Situation Varies From Country to Country(2008, in 100,000 people) 100,000 people Source: Eurostat
Again More Migration Within Europe
GDP Growth in Central Europe (EU10) vs. Employment Growth in Western Europe (EU15) EU10 (CE/SEE) EU-15 Employment GDP EU10 EU15 Source: wiiw
Growth vs. Decline in Employment 2000-2005 in % Source: Eurostat, Berlin Institute
Citizens of New EU Member States Increasingly Working in the West (CE work force working in EU 15 in % of total work force, 2007) Source: WIIW. Eurostat, OECD
43 Million Migrants EU 27: Where Do They Have Come From? 14 million migrants from other EU member states 29 million migrants from (today‘s) third countries - among them: 19 million from Africa, Asia, South America Source: Labour Force Survey 2007
Employment rates by citizenship, 2007 in % Source: EU LFS, Berlin Institute
European Migration in Times of Crisis • Return migration within EU • Additional incentives by EU governments for non-EU migrants to go back • Fewer remittances • Are we loosing people with talent and skills that we will soon need again?
European Migration in Times of Crisis • So far: More men than women have lost their jobs • In certain sectors and regions: growth of unemployment quicker among native-born than among foreign-born workers • Rigidities of the labour markets • Rigidities of the housing markets
Europe Is Getting Older! Population Structure in EU27, 2008 and 2060 Source: Eurostat, Convergence Scenario, Europop2008
Development of Labour Force and Old-Age-Dependency Ratio (no migration) Source: Eurostat, Convergence Scenario, Europop2008
Development of Labour Force and Old-Age-Dependency Ratio (+50 million immigrants) Source: Eurostat, Convergence Scenario, Europop2008
Who Does Best in Migration Policy? • Traditional immigration countries as a bench mark • UK • Sweden • Do we need joint action at EU level
What Do We Need? • Smart migration policies • A truly open single EU labour market • The willingness and ability to make use of talents and skills of future migrants • Better integration
Thank You! Rainer Muenz rainer.muenz@erstegroup.com