Download
1 / 20
200 likes | 280 Vues
The Confounding Effect of River Discharge on Estuarine Response to Nutrient Loading. Craig A. Stow NOAA Great Lakes Environmental Research Laboratory Ann Arbor, MI.

E N D
The Confounding Effect of River Discharge on Estuarine Response to Nutrient Loading Craig A. Stow NOAA Great Lakes Environmental Research Laboratory Ann Arbor, MI Borsuk, M. E., C. A. Stow, and K. H. Reckhow. 2004. Confounding effect of flow on estuarine response to nitrogen loading. Journal of Environmental Engineering, 130: 605-614. Additional Insights and Inputs provided by Conrad Lamon and Song Qian
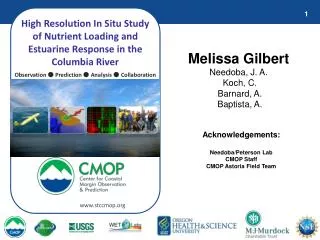
The Neuse River Basin Courtesy USGS
Vollenweider Cross-Sectional Lake Nutrient Loading Model • Single Lake Relationship: • Positive • Negative • Nonlinear Brazenly stolen from: Vollenweider, R.A. 1976. Advances in defining critical loading levels for phosphorus in lake eutrophication. Mem. Ist. Ital. Idrobiol., 33:53-83.
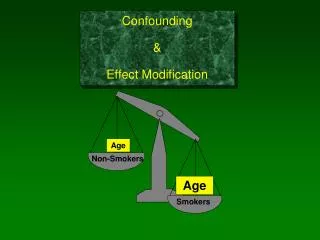
Residence Time Turbidity Salinity Temperature River Flow Nutrient Concentration Eutrophication Nutrient Loading Estimated Nutrient Loading Estimated Concentration= f(Flow)
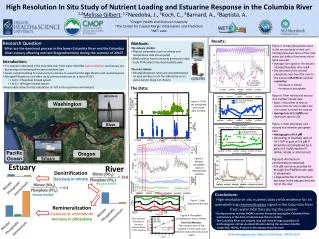
River discharge highly variable – even on relatively long time-scales Drives Nutrient Load Variability at this scale
Concentration:Flow relationships idiosyncratic: positive, negative, or non-monotonic In the Neuse the relationship was negative Log concentration Log flow • High load = low concentrations Data Provided by: NC DENR DWQ – nutrient concentrations USGS – daily flow
0 10 20 Upper 30 New Bern 40 50 Middle 180 60 170 l 70 Bend 80 160 l 90 150 100 140 l 110 Water Quality Station Hydrographic Station l 130 120 l l l l N 10 miles 10 kilometers Model Sections River Upper Middle Lower Bend
Chlorophyll a Model (Bayesian multilevel piecewise lognormal model)
Estuarine N Concentrations vs. Annual N Load Ft. Barnwell Swift Creek New Bern Broad Creek Oriental Pamlico
Estuarine P Concentrations vs. Annual P Load Ft. Barnwell Swift Creek New Bern Broad Creek Oriental Pamlico
Summary Nonlinear chlorophyll, flow (~ load) relationship on short time-scales Relationship differs systematically along spatial gradient Maximum differs systematically along spatial gradient No relationship between nutrient load, concentration on medium time-scales This may differ among systems
TMDLs Nutrient Loading Nutrient Loading Eutrophication Eutrophication Hypoxia Hypoxia
Nutrient load targets appropriate on longer (multi-year) time scales • Short-term (yearly or less) misleading • Assuming stationary flow (long-term)
Mississippi River Flow – Seasonal Trend Decomposition Using Loess
April 2006 - U.S. Court of Appeals District of Columbia Circuit ruled that EPA-approved plan to limit pollution into Anacostia River contrary to Clean Water Act requirements to set "total maximum daily loads" of pollutants. January 2007 -- United States Supreme Court let stand lower court ruling requiring limits on pollution allowed in Anacostia River each day.
River Flow Nutrient Concentration Eutrophication Nutrient Loading ? Hypoxia Upper Trophic Level Effects
River Flow Hypoxia Nutrient Loading Estimated Nutrient Loading