Download
1 / 16
160 likes | 348 Vues
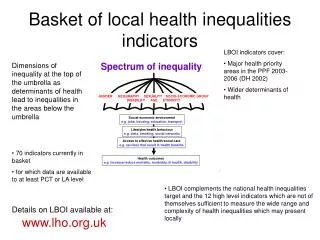
Unraveling the causes of health inequalities. Adam Wagstaff. What’s it all about?. Having measured inequalities, natural next step is to seek to account for them TN#15 and TN#14 present methods aimed at decomposing causes of inequality

E N D
Unraveling the causes of health inequalities Adam Wagstaff
What’s it all about? • Having measured inequalities, natural next step is to seek to account for them • TN#15 and TN#14 present methods aimed at decomposing causes of inequality • Core idea is that outcome variable is caused by a set of determinants, which vary systematically with SES • E.g. poor have lower income but also less knowledge, worse access to drinking water, lack insurance coverage, etc. • Want to know extent to which inequalities in health status are due to (a) inequalities in income, (b) inequalities in knowledge, (c) inequalities in access to drinking water, etc.
Oaxaca • Oaxaca decomposes gap in outcome vbl between two groups • Attraction of Oaxaca over decomposition in TN#14 is that it allows for the possibility that inequalities caused in part by differences in effects of determinants • For example, health of the poor may be less responsive to changes in insurance coverage, or to changes in access to drinking water, etc.
equation for non-poor y ynon-poor equation for poor ypoor xpoor xnon-poor x
equation for non-poor y ynon-poor equation for poor ypoor xpoor xnon-poor x
But how far due to diffs in b’s rather than diffs in x’s? equation for non-poor y ynon-poor equation for poor ypoor xpoor xnon-poor x
Oaxaca #1: eqn (4) equation for non-poor y ynon-poor Dbxnon-poor equation for poor Dxb poor ypoor xpoor xnon-poor x
Oaxaca #2: eqn (5) equation for non-poor y ynon-poor Dxbnon-poor Dbxnon-poor equation for poor Dbxpoor Dxb poor ypoor xpoor xnon-poor x
Seeing how to do it …through an example from Vietnam Av. HAZ z-score kids<10 yrs: Poor = -1.86 Non-poor = -1.44 Diff = 0.42 U.S. reference group = 0.00
The regression equation • y is the HAZ malnutrition score • Same regression model as Wagstaff et al. [8] • x includes • log of the child’s age in months (lnage) • sex = 1 if male • safewtr = 1 if drinking water is safe • oksan = 1 if satisfactory sanitation, • years of schooling of the child’s mother (schmom) • log of HH per capita consumption (lnpcexp) • poor = 1 if child’s HH is poor (if pcexp<Dong 1,790,000
Testing for significant differences in b’s in Stata xi: reg haz i.poor*lnage i.poor*sex i.poor*safwtr i.poor*oksan i.poor*schmom i.poor*lnpcexp [aw=wt] testparm _I*
Stata F-test output—sign. diffs. use separate eqns . testparm _I* ( 1) _Ipoor_1 = 0.0 ( 2) _IpooXlnage_1 = 0.0 ( 3) _IpooXsex_1 = 0.0 ( 4) _IpooXsafwt_1 = 0.0 ( 5) _IpooXoksan_1 = 0.0 ( 6) _IpooXschmo_1 = 0.0 ( 7) _IpooXlnpce_1 = 0.0 F( 7, 5154) = 2.03 Prob > F = 0.0472
Oaxaca in a chart Oaxaca #1 Oaxaca #2