Download
1 / 34
350 likes | 575 Vues
Jeff Skilling. President and CEO ENRON. Economic Trade-Off. Cost of Interaction. $. Value of Specialization. Volume. Evolution of Economic Trade-Off. 1300’s. 1800’s. Creation of Money. 2000’s. $. Transportation & Communication. Internet & InfoTech. Barter Economy. Volume.

E N D
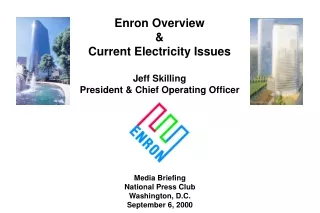
Jeff Skilling President and CEO ENRON
Economic Trade-Off Cost of Interaction $ Value of Specialization Volume
Evolution of Economic Trade-Off 1300’s 1800’s Creation of Money 2000’s $ Transportation & Communication Internet & InfoTech Barter Economy Volume
Credit Logistics Legal & Regulatory Price of Successful Economic Transactions Information Seeking & Gathering Payments Inventory Types of Interaction Costs Types of Interaction Costs
Financial Institutions Mining U.S. 30-40% 60-70% 55% India 40-50% Cost of Interaction Source: McKinsey
Business Structure Finished Product Transformation Costs Interaction Costs Total Costs 4.35 0.60 4.95 Business Structure Transformation Interaction .90 1.0 1.0 1.0 Finished Product .85 Transformation Costs Interaction Costs Total Costs .90 3.45 3.00 6.45 .80 .95 1.10 1.20 1.10 .20 .20 .20
Interaction Costs are Radically Falling for Teller Transactions. . . $1.50 $0.30 $0.01 1985 (Bank) 1995 (ATM) 2000 (Internet)
. . .and Natural Gas and Bandwidth Transactions Time to Provision Bandwidth Time to Execute a Long-Term Gas Contract 2-3 years 6-8 months 9 months 2-3 months 2 weeks < 1 second < 1 second 1995 Today Next Year 1981 1989 1997 2000
Change in Economics of Business Structure Transformation Interaction 1.0 .10 1.0 .10 1.0 .10 .90 Finished Product .85 Transformation Costs Interaction Costs Total Costs .90 3.45 3.00 6.45 3.45 0.30 3.75 .80 Finished Product Transformation Costs Interaction Costs Total Costs .95 1.10 1.20 1.10 4.35 0.60 4.95 .20 .20 .20
Where’s the Opportunity? .90 .10 .10 .10 .85 .90 .80 .95 1.10 1.20 1.10 .20 .20 .20
Not Cost Competitive Where’s the Opportunity? .90 .10 .10 .10 .85 .90 .80 .95 1.10 1.20 1.10 .20 .20 .20
Commoditized • Overcapitalized • Globalized • Can’t make compensatory • return in traditional asset • business Where’s the Opportunity? .90 .10 .10 .10 .85 .90 .80 .95 1.10 1.20 1.10 .20 .20 .20
Creating low cost, dependable • market interfaces • Market making • Logistics • Back office • Trade finance Where’s the Opportunity? .90 .10 .10 .10 .85 .90 .80 .95 1.10 1.20 1.10 .20 .20 .20
.90 .10 .10 .10 .85 .90 .80 .95 1.10 1.20 1.10 .20 .20 .20 Where’s the Opportunity? • Providing packaged turnkey • solutions for customers • Complex structures • Differentiation • Customization “Virtual” Integration
. . . and Resource Model Traditional • Asset intensive • Vertically integrated • Slow moving and rigid • Hierarchical • Networked • “Real options” oriented • Brain power intensive • Fast moving & entrepreneurial New
Enron’s e-Commerce Strategy • Define and make new markets (core competency) • Utilize strong skills in risk intermediation & credit and risk control • systems • Expand and extend existing businesses and increase access to prices and products via e-Commerce Enron’s strategy grows directly out of the Enron culture
$358 $291 1999 2000 In-House Technology Resources Wholesale Services Expenditures (Millions) People 1,380 1,154 1999 2000
e-Commerce Initiatives Commodities EnronOnline.com Pulp, Paper & Lumber Clickpaper.com Mid/Back Office CommodityLogic.com Credit Enron Credit Auction/Data Rooms DealBench.com
EnronOnline Changing the Way Commodities are Bought and Sold A Free Internet-based, Global Transaction System Which Allow Counterparties to View Real Time Prices From Enron’s Traders and Transact Instantly Online
Enron Online Completed 1,000,000 transactions on May 23, 2001
EnronOnline Statistics • Total Life to Date Transactions > 1,020,000 • Average Daily Transactions > 4,700 • Life to Date Notional Value of Transactions > $610 billion • Daily Notional Value Approximately $2.8 billion • Number of Products Offered: Approximately 1,600 • Number of Currencies Traded in = 13 • EnronOnline Version 1.0 Launch Date: November 29, 1999 • EnronOnline Version 2.0 Launch Date: September 18, 2000
EnronOnline Product Slate May 2001 1999 - 4Q • Natural Gas • U.S. • U.K. • Belgium • Argentina • Canada • Power • U.S. • Germany • Holland • Switzerland • Australia • Coal • Europe • U.S. • International • Options • Continental power options • Nuclear outage knock-in call options • US & UK gas options • U.S. Gas Spreads • U.S. Gas Pipeline Capacity • Natural Gas • U.S. • Canada • Power • U.S. • Nordic • Coal • Pulp & Paper • Plastics • Metals • U.S. • U.K. (LME Contacts) • Japan • Asia • Metal Spreads • U.K. • Sea Freight • U.S. Lumber • Auctions • Emissions • EnBank Virtual • Storage • Credit Derivatives • Aluminum • Japan • Holland • Options • Continental Power • Nuclear outage Knock-in call option • Nordic power • U.S. and U.K. gas • Bandwidth • Weather • U.S. • Europe • Japan • Australia • Emissions • Crude & Refined Products • Asia • Petrochemicals • Plastics • LPG • U.S. Steel • Pulp & Paper • Auction • Emissions (U.S.) • Enbank virtual storage (U.K.) • Pipeline Capacity • U.K. • Spain • Austria • Nordic Countries • Canada
EnronOnline Utilization Online Transactions as a % of Total Transactions 55% 52% 49% 43% 39% 25% 4Q 1Q 2Q 3Q* 4Q 1Q 2001 2000 1999 * The percentage of transactions on EOL declined in 3Q00 due to the purchases of MG Metals
EnronOnline Efficiency Gains Transactions Per Market Maker Marginal Cost Per Transaction (Indexed) 100 3,084 25 672 2000 1999 1999 2000
All Major Platforms Reporting Combined (Includes Altrade U.S. Gas, Intercontinental Exchange and NGX) EnronOnline EnronOnline vs. Major Competitors North American Natural Gas and Power (TBtue) 31,151 24,228 23,149 22,594 10,625 3,680 3,119 1,689 1,452 1,021 3Q00 2Q00 4Q00 1Q01 1Q00
Clickpaper.com Improving the Pulp & Paper Industry A free, internet-based system to buy and sell Forest products with Enron in real time
CommodityLogic.com Making Back-office Systems More Efficient An internet-based system that allows users to automate fulfillment process from confirmation through physical delivery, invoicing and payment
Enron Credit Assessing and Managing Credit Risk Provides live credit prices and enables customers to hedge credit exposure
DealBench.com Facilitating Price Discovery...The Art of the Paperless Deal An internet-based system for auctions, online collaborations using e-RFPs, internet roadshows and virtual data-rooms
Conclusion Conclusion “Sticking a big shiny ‘dot’ on your tired brick-and-mortar business model won’t do the trick. To truly excel, you’re going to have to reinvent your company fast enough to stay relevant in a dramatically discontinuous world.” - Gary Hamel
The Internet: Fastest Social Change in History U.S. Users (Millions) Radio Television Cable Internet Source: Jupiter Communications