Download
1 / 18
180 likes | 378 Vues
Dataset Shift Detection in Non-Stationary Environments using EWMA Charts. Prof. Girijesh Prasad Co-authors: Haider Raza, Yuhua Li School of Computing & Intelligent Systems @ Magee , Faculty of Computing & Engineering, Derry~Londonderry . g.prasad@ulster.ac.uk. Outline. Motivation

E N D
Dataset Shift Detection in Non-Stationary Environments using EWMA Charts Prof.Girijesh Prasad Co-authors: Haider Raza, Yuhua Li School of Computing & Intelligent Systems @ Magee, Faculty of Computing & Engineering, Derry~Londonderry. g.prasad@ulster.ac.uk
Outline • Motivation • Background • Proposed contribution • Future work and Conclusion
Motivation • Classical learning systems are built upon the assumption that the input data distribution for the trainingand testing are same. • Real-world environments are often non-stationary(e.g., EEG-based BCI) • So, learning in real-time environments is difficult due to the non-stationarity effects and the performance of system degrades with time. • So, predictors need to adapt online. However, online adaptation particularly for classifiers is difficult to perform and should be avoided as far as possible and this requires performing in real-time: • Non-stationary shift-detection test.
Background • Supervised learning • Non-stationary environments • Dataset shift Dataset shift-detection(Shewhart 1939), (Page 1954), (Roberts 1959), (Alippi et al. 2011b), (Alippi & Roveri 2008a; Alippi & Roveri 2008b) Dataset shift (Torres et al. 2012), Non-stationary environments (M Krauledat 2008), (Sugiyama 2012). • Dataset shift-detection Supervised learning (Mitchell, 1997) (Sugiyama et al. 2009) Proposed Work Shift-Detection • Proposed Work
Supervised Learning • Training samples: Input and output ( • Learn input-output rule: • Assumption: “Trainingand test samples are drawn from same probability distribution” i.e., Is this assumption really true? Reason :- Non-StationaryEnvironments ! No….!!! Not always true
Non-Stationarity For examples: • Learning from past only is of limited use • Brain-computer interface • Robot control • Remote sensing application • Network intrusion detection What is the challenge?
Dataset Shift Dataset Shift appears when training and testjoint distributions are different. That is, when (Torres, 2012) *Note : Relationship between covariates (x) and class label (y) XY: Predictive model (e.g., spam filtering) YX: Generative model (e.g., Fault detection ) Types of Dataset Shift • Covariate Shift • Prior Probability Shift • Concept Shift Prior probability shift appears only in YX problems Concept shifts appears • Covariate shift appears only in XYproblems
Dataset Shift-Detection Detecting abrupt and gradual shifts in time-series data is called the data shift-detection. Types of Shift-Detection • Retrospective/offline-detection: (i.e., Shift-point analysis) • Real-time/online-detection: (i.e., Control charts) Types of Control Charts • Shewart Chart (Shewart, 1939) • Cumulative Sum(CUSUM) (E S Page, 1954) • Exponentially Weighted Moving Average (EWMA) (S W Roberts, 1959) • Computational Intelligence CUSUM (CI-CUSUM) (Alippi et al., 2008) • Intersection of Confidence Interval (ICI) (Alippi et al., 2011 )
Proposed Contribution • We have proposed dataset shift-detection test. • Shift-Detection based on Exponentially Weight Moving Average (SD-EWMA) model
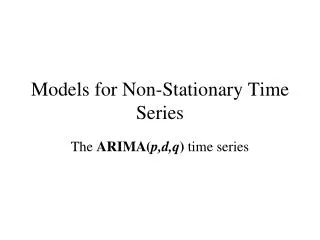
Shift-Detection based on Exponentially Weight Moving Average (SD-EWMA) (1) where λ is the smoothing constant (0<λ≤1). It is a first-order integrated moving average (ARIMA) model. (2) Where is a sequence of i.i.d random signal with zero mean and constant variance. Equation (1) with , is the optimal 1-step-ahead prediction for this process The 1-step-aheaderror are calculated as (3) IF the 1-step-ahead erroris normally distributed, then UCL LCL
Datasets Synthetic Data Dataset 1-Jumping Mean (D1): where is a noise with mean and standard deviation 1.5. The initial values are set as. A change point is inserted at every 100 time steps by setting the noise mean at time as where is a natural number such that. Dataset 2-Scaling Variance (D2): The change point is inserted at every 100 time steps by setting the noise standard deviation at time as where is a natural number such that Dataset 3-Positive-Auto-correlated (D3): The dataset is consisting of 2000 data-points, the non stationarity occurs in the middle of the data stream, shifting from to, where denotes the normal distribution with mean and standard deviation respectively.
Dataset 4-Auto-correlated (D4): The dataset is a time-series consisting of 2000 data-points using 1-D digital filter from matlab. The filter function creates a direct form II transposed implementation of a standard difference equation. In the filter, the denominator coefficient is changed from 2 to 0.5 after producing 1000 number of points. Real-world Dataset: EEG Based Brain Signals The real-world data used here are from BCI competition-III dataset (IV-b). This dataset, contains 2 classes, 118 EEG channels (0.05-200Hz), 1000Hz sampling rate which is down-sampled to 100Hz, 210 training trials, and 420 test trials. Figure : pdf plot of 3 different sessions’ data taken from the training dataset. It is clear from the plot that, in each session the distribution is changed by shifting the mean from session-to-session transfer.
Figure: Shift detection based on SD-EWMA: Dataset 1 (jumping mean): (a) the shift point is detected at every 100th point. (b) Zoomed view of figure a: shift is detected at 401st sample by crossing the upper control limit. (a) (b) Figure : Shift detection based on SD-EWMA: (a) Dataset 2 (scaling variance): the shift is detected at 3 points. (b) Dataset 3 (positive auto-correlated): detects the shift after producing 1000 observations. (c) Dataset 4 (Auto-correlated): detects the shift after producing 1000 observations.
Table :SD-EWMA shift detection in time-series data Table : Simulation results on different tests
Figure 4: A window of 2000 samples obtained from real-world dataset. Table 4: SD-EWMA shift detection in BCI data
Conclusion and Future Work • The drawback of classical supervised learning techniques in non-stationary environments and the motivation behind the dataset shift-detection were discussed. • The background of non-stationary environments and dataset shift-detection were presented. • A proposed SD-EWMA method is presented and the results are discussed. • In future, the SD-EWMAwill be combined into an adaptive learning framework for non-stationary learning.
Questions Thank You !