Download
1 / 24
240 likes | 421 Vues
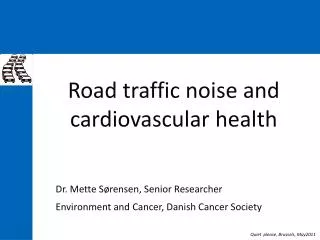
Road traffic injury risk in a regional public health perspective. Stig H. Jorgensen Department of Geography, Norwegian University of Science and Technology (NTNU) NO-7491 Trondheim, Norway Paper for The Society for Risk Analysis – Europe conference:

E N D
Road traffic injury risk in a regional public health perspective Stig H. Jorgensen Department of Geography, Norwegian University of Science and Technology (NTNU) NO-7491 Trondheim, Norway Paper for The Society for Risk Analysis – Europe conference: Innovation and Technical Progress: Benefit without Risk? Ljubljana 11 – 13 September, 2006
Overview • Discuss effects of a massive strategy for road safety and risk minimizing (Vision Zero) • Present geographical and structural trends for private motor vehicle crashes, Norway 1998 – 2004. • The scopes for following up strategies on road safety and health promotion in a regional perspective • Conclusions.
The Vision Zero strategy • Carried out year 2000. • Focus: seriously injured and killed road users. (Zero fatal traffic injuries year 2030?) • A system risk perspective: the interplay of road users and vehicles in the road system. • A contract between: road authorities (system designers) and individuals (road users).
Background: road safety and public health • A new paradigm (and demand?) for road traffic in public health. • Basic principles founded in ethics and equity. (cf. ’innocent’ victims in crashes, the value of a life lost in traffic) • Unnecessary and avoidable health risks (?) • Public health trade off for other (transport) benefits. (accessibility, regional competition and attractiveness) • Smoothing out structural (system) inequalities in public health risk. (pollution; food and water quality etc.) • System functions versus individual responsibility and risk taking.
Implications of risk minimization • Unrealistic (system risk, human unfallibility) • Individualism (freedom, coping capacity) vs standardisation • The possibility for injuring other (’innocent’) road users Risk minimization versus risk optimization • ” Zero risk” urges perfectionism • ”Healthism”, tolerance for deviation • Territorial justice is difficult to achieve
Possibilities for implementing efficient safety measures Physical environment, land use and transportation modes • Road network investments • Traffic calming schemes Enforcement and controls (depriving of freedom) • Police enforcement, speed cameras Drivers attitudes and risk-taking behaviour • Education, training, campaigns • Public consciousness, publicity • Diffusion of safety behavioural changes (safety culture) Vehicle safety devices and technology • Alcohol interlocks, • Intelligent speed limiters
Safety priorities favouring urbanised areas ? Intended effects: • The per capita principle and road safety investments • Concentrated in areas with the highest absolute no. of fatalities • Supported by cost-effectiveness/cost-benefit assessments • Preferences for population strategies towards low-risk groups Non-intended effects: • Concentrated efforts in high traffic volume areas: a systematic geographical difference in the relative risk level. • A redistribution, with a higher risk level in the rural areas ? More risk prone rural population?
Traffic accident data • Police-recorded road traffic accidents 1998-2004. (Norwegian Public Roads Administration) • Selection: motorized road users, private 4-wheel automobiles: killed and seriously injured (N= 5233) • Population based approach: the casualty’s place of residence • - Degree of coverage for residential municipality (1999-2004) • - for the whole country: 84.8 % (N = 4247 out of 5008) • Specific missing percentages for: adequate protection: 39% alcohol suspicion: 1% • Possible systematic bias: underreporting in rural municipalities
Grouping of municipalities into area types Classification by: • Population density (percentages in densely populated areas) • Size of settlement (< 5 000, 5 0000-14 999, > 15 000)
Fig. 1 Map of Norwegian municipalities displayed by an rural-urban gradient 1998 - 2004
Fig. 2 Number of killed and seriously injured people, in private 4-wheel motor vehicles, by sparsely/densely populated area and type of place of accident. Norway 1999 – 2004.
Fig. 3 Percentage of killed and seriously injured people, in private 4-wheel motor vehicles, by sparsely/densely populated area and type of place of accident. Norway 1998 – 2004.
Fig. 4 Killed and seriously injured people, in private 4-wheel motor vehicles. Rate per 100, 000 population (sex and age adjusted) by sparsely/densely populated area and type of place of residence. Norway 2004 (N rural = 299) (N periurban= 171) (N urban = 234)
Fig. 5 Percentage of killed and seriously injured people, in private 4-wheel motor vehicles, by type of place of residence. Norway 1999 – 2004. (N 6 years = 1709) (N 6 years = 994) (N 6 years = 1537)
Fig. 6 Percentage killed and seriously injured people not using seatbelts, in private 4-wheel motor vehicles by type of place of residence. Norway 1998 - 2004. (N 7 years = 352) (N 7 years = 167) (N 7 years = 158)
Fig. 7 Percentage killed and seriously injured people with suspicion of alcohol alcohol in private 4-wheel motor vehicles by type of place of residence. Norway 1998 - 2004. (N 6 years = 292) (N 6 years = 128) (N 6 years = 255)
Fig. 8 Percentage killed and seriously injured males involved in risk taking driving (non-usage of seatbelt or alcohol or running off the road) 4-wheel motor vehicles by age and type of place of residence. Norway 1999-2004.
Table 3. Road traffic injury rates (for 7 years), killed and serious injured 4 wheel motorised road users per 1000 population, by type of residential municipality (education). Norway 1998-2004.
Goal and intrests conflicts The traffic system vs. the health system • Local health safety versus to consolidate settlements • Market failures and negative external effects in the road transport system • Health risks are often considered as long time accummulated risks (smoking, diet habits)
Geographical redistribution of risk • Structural inequality (in specific geographical environments) • Non-intended results of efficiency and accessability • Territotial equity and uneven development in health policy • Neo-liberalism winds (favouring market competition solutions, and distributions) • Compensation mechanisms ?
Strategies • ”Standardisation” of human (driving) activities • Technical control of risk minimizing behaviour • Widespread surveillance and control system
Risk minimising strategies Balancing urban-rural efficiency, equality and equity • Compensation, positive discrimination in road improvements • Implementation of non-human control systems • Tailor made behavioural campaigns (local engagement)
Conclusions • Killed and seriously injured automobile occupants are concentrated in sparsely populated areas. • Disparities urban - rural areas are not increasing over time. Effects of “Vision Zero” regarding road users place of residence: • Rural people face a higher serious accident rate. • A geographical redistribution of crash risk in disfavour of sparsely populated areas, not in disfavour of rural areas in general. • No tendencies to absolute reductions or redistribution of casualties related to driving violation
A public health goal of risk minimization seems less feasible in rural and sparsely populated areas for various geographical and structural reasons. • Stronger, and more controversal, countermeasures have to be implemented in rural areas • The effects have to be monitored for a longer time span.