Download

1 / 65
650 likes | 653 Vues
Explore recent issues in open economy savings, including the tax cut and forward-looking behavior, through readings on Adam Smith, Dani Rodrik, and more.

E N D
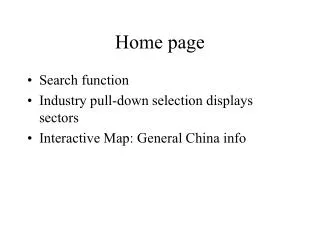
ECO 306 Home Page http:/www.depaul.edu/~jberdell Select Eco306 ID: macro PW: theory Next week lots of reading: Ch6 Adam Smith Sachs and Warner Dani Rodrik Schleifer
W3B Outline 2 Recent Issues 2.1) The Tax Cut, Forward looking behavior and Ricardian Equivalence 2.2) The long term fiscal outlook 3) Open economy savings 3.1) Use (or source) of Savings Approach 3.2) Absorption Approach 3.3) USA vs Emerging Markets as borrowers 3.4) The the US Savings rate a problem?
2001-02 Savings + Consumption Does the response to the tax cut indicate that very rational consumers saved the tax cut because they thought that it would result in higher taxation in the future? “Ricardian Equivalence” Why did they spend so little of it? (NBER paper, is optional) What sort of forward looking behavior did they exhibit?
Chapter 4 Table 1 Ricardian Equivalence and the Tax Cut of May 2001 Chapter 4 Table 1 Ricardian Equivalence and theTax Cut of May 2001
2001 Tax Rebate, Shapiro and Slemrod 2001 Tax Rebate, Shapiro and Slemrod 2001 Rebate $300 individual $600 Couples=$38 B, 0.4%GDP 15% bracket was retroactively changed to 10% (first $6,000 of taxable income) Retrospective Survey: 24.9% Mostly spent the rebate 27.1% Mostly saved the rebate 48% Mostly paid down debt Past tax cuts saw 50% Mostly Spend for an MPC of 0.6-0.9 25% Mostly Spend this(say Shapiro and Slemrod) is an MPC of 0.34-0.37
2001 Rebate:Theories Consumption theories considered: life cycle (your point in life cycle det’s MPC) habits (spending habits det MPC) forward looking behavior rational expectation of household future finances (ir)rational view of general economic cond. Life Cycle Theory Older consumers had highest MPC. Habits: couldn’t link spending and “difficulty of cutting back on usual spending”
2001 Rebate: Expectations Forward Looking Behavior: “Does your family have enough income to sustain your Current level of spending for the foreseeable future?” Doesn’t explain spending response well. Views on the state of the national economy one year in the future do.
2001 Rebate Debate “in terms of the ability to explain the cross-sectional differences in spending rates, a person’s expectations of where the aggregate economy is headed seems to be much more powerful than their expectations about their own family’s financial conditions.” heard behavior and animal spirits (Keynesian)? Consumers expected bad times and saved. Or Rational forward looking consumers (Classical)? Ricardian Equivalence.
Government Debts/GDP Federal is in hands of investors ends 4/1/2011
The Big Numbers • Gokahle and Smetters estimated the “present value” of the fiscal gap between future gov. recipts and expenditures. • Present Value means that we look at the current value of future dollars since a dollar today is worth more than a dollar in 30 years! • Receipts are estimated using current tax rules and estimates of future potential output. • Expenditures are estimated based on entitlement projections (this is really tricky) The study may be found at: http://www.clevelandfed.org/Research/PolicyDis/no5dec03.pdf
Here it is • 45T$ gap (4X GDP) • 4T$ “official” debt held by public • 7.2T$ ‘implicit’ social security debt • 43.6T$ ‘implicit’ medicare debt More good news: Kotlikoff is up to 202 billion in 2010 http://www.kotlikoff.net/content/us-bankrupt-and-we-dont-even-know-it
The numbers are hard to estimate • The Medicare ‘debt’ is very hard to calculate. G&S assume that US life spans will catch up to current Japanese life spans, but the Japanese are lengthening their lives by 2.5 years per decade. • G&S assume that benefits per Medicare beneficiary will rise at 1% per yr. faster than real wage growth. It has been rising at 2.7% more than real wage growth.
Pay as You Go Retirement Fund Good time to be a worker.
Pop 65 and over workers per beneficiary 4.1% 1900 16.5 1950 12.4% 2000 3.4 2000 19.4% 2030 2 2030 Workers Per Beneficiary
Main Causes of the Fiscal Crisis • Post War Demographic Boom • Extension of life • By 2.5 years per decade over the past 150 yrs • Increasingly costly means of extending and caring for the longer lived
You can pay me now or…. If it is implausible that taxes will be increased by this amount, then the future trajectory of Medicare expenditures will have to differ from the forecast.
Use ‘Roth’ IRAs over 401Ks • …we find that low- and moderate-income households actually raise their lifetime taxes and lower their lifetime expenditures by saving in a 401(k) plan. • These findings are driven, in large part, by the additional Social Security benefit taxation induced by 401(k) withdrawals. Does Participating in a 401(k) Raise Your Lifetime Taxes? Jagadeesh Gokhale, Laurence J. Kotlikoff, Todd Neumann NBER Working Paper No. w8341 http://www.nber.org/papers/w8341
Open Economy Savings 1 The Balance of Payments System 2 Use (Source) of Savings 3 Absorption Approach 4 Shocks and Buffering 5 International Capital Flows 6 US Savings What do Classicals and Keynesians see and ask?
2007 The U.S. current-account deficit--the combined balances on trade in goods and services, income, and net unilateral current transfers--decreased to $178.5 billion (preliminary) in the third quarter of 2007 Net income still > 0 Net financial inflows--- were $93.4 billion in the third quarter,
BOP Transactions sum to 0 • We can break, for instance, case II into steps. • First a US importer buys sweaters (in $) from the UK. The UK exporter gets a dollar deposit in the US. So in theUS BOP: • - 25$ Imports and +25 $ Financial Account (U.S. liabilities reported by U.S. banks, not included elsewhere) • Then UK firm uses its $ deposit to buy a US bond: • -25$ U.S. credits reported by U.S. Banks etc.. +25$ U.S. Treasury Securities
2.5 Some Identities Private Disposable Income=Y+NFP+TR+INT-T NFP net factor payments from abroad TR transfers from gov. INT interest payments from gov. T taxes to gov. Sprvt=(Y+NFP+TR+INT-T)-C Sgov=T-(G+TR+INT) (Note Sgov is mostly borrowing though some could be base money creation.) S=Spvt+Sgovt=Y+NFP-C-G, (Note: Y+NFP=GNP)
2.5 Some Identities Cont. S=Spvt+Sgovt=Y+NFP-C-G S=(C+I+G+NX)+NFP-C-G S=I+(NX+NFP) S=I+CA Spvt=I+(-Sgov)+CA With constant Spvt a gov. deficit either: crowds out I or crowds out NX, causing a “twin deficit”
Use/Source of Savings S is total savings, private and public If a country saves more than it invests it sends it abroad. S>I means CA>0 If a country invests more than it saves it borrows from abroad. I>S means –(CA)>0 and CA<0
Absorption Approach (IMF) If the trade deficit is too negative, or needs to become positive, you must lower domestic absorption Domestic Resource Absorption
Absorption Approach (IMF) If the trade deficit is too negative, or needs to become positive, you must lower domestic absorption Domestic Resource Absorption How might domestic absorption fall? Classical view: higher interest rates cause C and I to fall without a reduction in Y, but higher interest rates generally cause currency appreciation. Keynesian view: lower consumption and investment spending generally cause lower output, so adjustment of trade deficit is associated with recession.
Figure 2.01 The uses-of-saving identity in the United States, 1959-1998 (2.5) Figure 2.01 The uses-of-saving identity in the United States, 1959-1998 Twin deficits clear in 80’s not in 90’s. 90’s trade deficit from rising Investment.
Velde vs Levy Institute Classical long run concern: how does US savings affect our long term standard of living, are we consuming the next generation’s corn? Keynesian short run concern: what does past savings behavior tell us about where spending will/can come From to keep growth moving in the next few years?
Personal Savings from Velde Personal Savings Is Down
Net Private Saving from Velde But Net Private Savings isn’t so bad because firms also matter
Total Savings from Velde Gov was saving for households in late ’90s
Velde: good reasons not to worry • Gov and firms have been saving for consumers, • If given a tax break they would save it. ((Which we saw • above they did.)) Ricardian Equivalence. • To the extent that total savings as a % of GDP has • Fallen, it is because the relative price of investment • goods has fallen. We don’t need to abstain as much • In order to provide the future with capital goods.
The Keynesian view Is Personal Debt Sustainable? DIMITRI B. PAPADIMITRIOU, ANWAR SHAIKH, CLAUDIO DOS SANTOS GENNARO ZEZZA. STRATEGIC PROSPECTS AND POLICIES FOR THE U.S. ECONOMY Wynne Godley and Alex Izurieta The Levy Economics Institute of Bard College
Sector Financial Balances Rising personal debt means that debt fueled spending can’t continue. http://www.levy.org/docs/stratan/pdfs/perdebt.pdf
SUSTAINING RECOVERY: MEDIUM-TERM PROSPECTS AND POLICIES FOR THE U.S. ECONOMY
Levy Economics Institute of Bard College • Strategic Analysis • March 2011 • JOBLESS RECOVERY IS NO • RECOVERY: PROSPECTS FOR • THE US ECONOMY • http://www.levyinstitute.org/pubs/sa_mar_11.pdf