Download
1 / 23

E N D
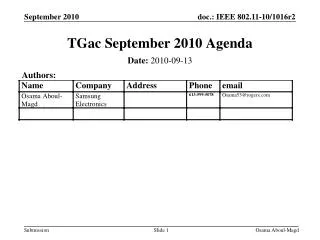
The Impact of Composition on the Thermosphere Mass Density during Geomagnetic ActivityJeffrey P. Thayer, Xianjing Lui, Jiuhou Lei, Marcin Pilinski and Alan BurnsThanks to Eric Sutton for the analyzed CHAMP and GRACE data Thayer, J. P., X. Liu, J. Lei, M. Pilinski, and A. G. Burns (2012), The impact of helium on thermosphere mass density response to geomagnetic activity during the recent solar minimum, J. Geophys. Res., 117, A07315, doi:10.1029/2012JA017832. MURI NADIR Meeting 25–26 September 2012
h P 2 D P 1 Altitude B C Satellite altitude A Quiet Active Mass Density Response with Altitude to Geomagnetic Activity Density Scale Height
Occasions of Common Local Time Passes of CHAMP and GRACE Satellites Bruinsma, S. L., and J. M. Forbes (2010), Anomalous behavior of the thermosphere during solar minimum observed by CHAMP and GRACE, J. Geophys. Res., 115, A11323, doi:10.1029/2010JA015605.
CHAMP to GRACE Ratio: February 2007 1 29 Feb 2007
MSIS C/G Ratio Feb 2007 Latitude-time plot of the natural logarithm of the MSIS mass density ratio normalized by the altitude difference for CHAMP and GRACE satellites over a 29 day period starting from February 1, 2007.
Summer / Winter CHAMP to GRACE Ratio: February 2007 Observations MSIS 29 1 Feb 2007
MSIS C/G Ratio Behavior with Geomagnetic Activity: Feb 2007 • Summer: • C/G ratio driven by pressure scale height whose response to geomagnetic activity is related to temperature changes • Winter: • Pressure scale height is invariant with geomagnetic activity as temperature increases are offset by increase in molecular weight. • Molecular weight scale height is responsible for the wintertime C/G exceeding summer and for the wintertime response to geomagnetic activity. Geomag activity
Summer / WinterCHAMP to GRACERatio: Dec. 2008 Observations MSIS
Adjusted MSIS by reducing F10.7 and increasing Helium concentration by 30% above 50N CHAMP and GRACE mass density estimates (red line) versus geographic latitude averaged over December 9-10, 2008. Adjusted MSIS mass density estimates after reducing F10.7 index by 14 sfu and increasing ap by 2 (black line), further adjustment by increasing helium by 30% above 50 °N (black dashed line), and excluding helium in the estimate of MSIS mass density after F10.7 and ap adjustment (black dash-dot line). Error bars on GRACE density represent the statistical error of the mean after two-day averaging.
Summer / WinterCHAMP to GRACERatio: Dec. 2008 Observations Adjusted MSIS
MSIS C/G Ratio Behavior with Geomagnetic Activity: Dec. 2008 • Summer: • C/G ratio driven by pressure scale height whose response to geomagnetic activity is related to temperature and molecular weight changes • Winter: • Pressure scale height change is now dominated by the molecular weight change being greater than the temperature change with geomagnetic activity. • Molecular weight scale decreases with geomagnetic activity – opposite to the pressure scale height effect. Geomag activity
Oxygen – Helium Transition Dynamics Impacts the Mass Density with Height Mean Molecular WeightScale Height Mean Molecular Weight
Composition Effects on Thermosphere Mass Density During Geomagnetic Activity • The February 2007 data represented typical solar minimum conditions while the December 2008 data represented extreme solar minimum conditions. • The CHAMP-to-GRACE mass density ratio for both solstice periods indicates the dynamics of the oxygen – helium transition region is playing a role in describing the mass density ratio structure and response to geomagnetic activity in the winter hemisphere. • The description of the C/G mass density ratio in terms of the sum of the reciprocal pressure scale height and the reciprocal molecular weight scale height, or equivalently proportional to the ratio in mean molecular weight to temperature plus the vertical gradient of the logarithmic mean molecular weight, provided insight to the observed behavior
Cont’d • Significant concentrations of helium exist at GRACE altitudes (472 km) during quiet geomagnetic activity in the winter hemisphere at solstice in 2008, i.e., the wintertime helium bulge • The dynamics of the oxygen-helium transition height will prove very important in evaluating the latitudinal thermosphere mass density response at GRACE altitudes as it resides above the satellite in the summer polar regions (750 km in December 2008) and below the satellite in the winter hemisphere (400 km in December 2008) Need information of composition with height to adequately describe the thermosphere density response to geomagnetic activity
CDxA as a Function of He/O Ratio GRACE panel model CDxA as a function of He/O ratio at two values of atmospheric temperature and angle of attack.
Figure A2. MSIS outputs for December 9th 2008, sampled along the GRACE orbit.
Altitude Response in Thermosphere Mass Density to Geomagnetic Activity Depends on Composition
Figure 9. The adjusted MSIS oxygen-helium transition altitude for the month of December, 2008.