Download
1 / 36
360 likes | 505 Vues
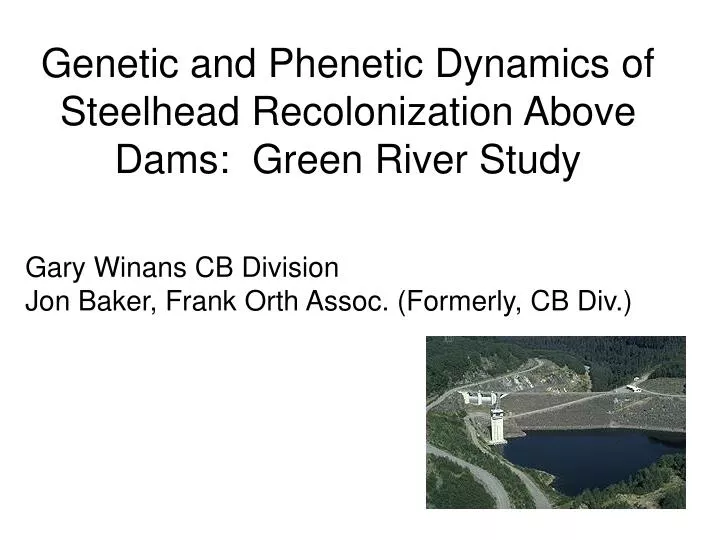
Genetic and Phenetic Dynamics of Steelhead Recolonization Above Dams: Green River Study. Gary Winans CB Division Jon Baker, Frank Orth Assoc. (Formerly, CB Div.). We are interested in Resident fish. and the potential “hybridization” of Resident trout and Anadromous Steelhead.

E N D
Genetic and Phenetic Dynamics of Steelhead Recolonization Above Dams: Green River Study Gary Winans CB Division Jon Baker, Frank Orth Assoc. (Formerly, CB Div.)
We are interested in Resident fish and the potential “hybridization” of Resident trout and Anadromous Steelhead
Our Research Interests: Character evolution in isolated populations • Non-smolting lifestyle (PSL, behavioral, & metabolic) • Body and fin designs • Body coloration • Evolutionarily-neutral genetic markers
During their 90 years of isolation, REZ fish will be different…due to • natural selection (non-smolting physiology, non-downstream behavior, growth, time of spawning, etc.) • random genetic changes • outplanting
NOAA is interested in mykiss populations sequestered behind dams • O. mykiss is endangered under the ESA • When dams are removed, what will be the role of Resident trout? • Who will produce naturally occurring recruits?
Our Research Interests: Character evolution in isolated populations • Non-smolting lifestyle (PSL, behavioral, & metabolic) • Body and fin designs • Body coloration • Evolutionarily-neutral genetic markers
RBT RBT RBT RBT N Green River RBT HH Dam residual wild Rm 68 Rm 84 hatchery
Hatchery= 50 + 50 Green River- Genetic data Cedar R. Wilds = 50 HH Dam Residents=81 Wild=77 Rm 84 Rm 68 N Calif. Trout = 50 + 50
Hatchery= 50 + 50 Green River- Genetic data “Nearest Neighbor” Cedar R. Wilds = 50 HH Dam Residents=81 Wild=77 Rm 84 Rm 68 N “Hatchery Outplants” Calif. Trout = 50 + 50
Ocl1 Ogo4 Omy7 INRA Onem14 Ots100 Ots4 Oke4 Oki23 Omy1011 Omy77 Ssa289 Ssa407 Ssa408 mSAT Loci
“102” CA CA CA CA CA CA CA CA CA CA CA “100” CA CA CA CA CA CA CA CA CA CA “96” CA CA CA CA CA CA CA CA “94” CA CA CA CA CA CA CA Microsatellite markers—simple sequence repeats - Allele designations typically related to fragment size
1=Resident 2=Native 3=Hatchery Diversity at 13 mSAT loci 13 12 11 Mean No. of Alleles per Locus 10 9 8 0.65 0.70 0.75 0.80 0.85 Mean Heterozygosity
15 10 Mean No. of Alleles per Locus 5 1=Resident 2=Native 3=Hatchery 4=Cal. Trout 0 0.73 0.90 0.63 0.50 Mean Heterozygosity per locus
Cal Trout 1 Cal Trout 2 Cedar River Hatch 2 Hatch 1 Resident 1 Native 1 Native 2 Resident 2 Nei’s D Resident 3 0.1
Hatchery= 20 + 20 Green River- Morphology data Cedar R. Wilds “Nearest Neighbor” HH Dam Residents=20 Wild=20 Rm 84 Rm 68 N “Hatchery outplants” Calif. Trout
Thin Plate Spline/Relative Warps • Each fish is represented by a set of landmarks • Each fish is compared to a consensus outline; a similarity value generated • A similarity matrix is assesed by a PCA • Producing the relative warps (RWs)
RW Analysis of Body Shape 0.05 0.04 0.03 0.02 0.01 RW4 0.00 -0.01 -0.02 1=Above -0.03 2=Below -0.04 0.00 0.01 0.02 0.03 0.04 0.05 -0.05 -0.04 -0.03 -0.02 -0.01 RW1
Shape differences: resident vs. consensus Resident Neg RW1; elongate nose, deeper head; deeper trunk; v. shortened CP
Head LL Dorsal Split Mid LL Dorsal Split Tail Dorsal Split
Resident Hatchery 1 8 0.4 15 0.9 7 0.8 6 0.3 0.7 10 0.6 5 0.5 Count Count 4 0.2 Proportion per Bar Proportion per Bar 0.4 3 5 0.3 2 0.1 0.2 1 0.1 0 0.0 0 0.0 0 1 2 3 4 5 0 1 2 3 4 5 MID_D_PARR MID_D_PARR Hatchery 2 Native 15 15 0.7 0.7 0.6 0.6 0.5 0.5 10 10 0.4 0.4 Count Count Proportion per Bar Proportion per Bar 0.3 0.3 5 5 0.2 0.2 0.1 0.1 0.0 0 0.0 0 0 1 2 3 4 5 0 1 2 3 4 5 MID_D_PARR MID_D_PARR
3 2 1 PCA3 0 1=residents -1 2=wild 3=hatchery -2 -2 -1 0 1 2 3 4 5 PCA1
Parr Mark Analysis 3 2 t=4.16, P=0.0 1 PCA3 0 1=above -1 2=below -2 -2 -1 0 1 2 3 4 5 PCA1
Above-Elwha Dam Below-Elwha Dam Mean=10.5 Mean=9.15 Mean=9.6 Mean=8.95 Mean=9.4 Lateral Line Parr Above 9.9 vs. Below 9.1 ***
Further Analyses • Hardy-Weinberg • Disequilibrium • Bootstrap D values • Rare alleles • F statistics • Contingency tables • PCA of allele frequencies • MM--ontogenetic influences • MM--PCA of truss-network characters
Resident fish above the dam are not genetically dissimilar from “Native” late-run fish below the dam Resident fish are different from hatchery fish Juvenile resident fish have different body shapes and parr mark patterns
Did we find a unique gene pool (a Gem) above the HH dam? • Is there evidence that there is a population of ‘residualized’ steelhead above HH dam? • Can we use these mSATs to recognize resident x steelhead crosses?
Is there a general pattern in genetic • and phenetic variability in resident fish vs. • downstream steelhead? • Green River: (Internal Grant seed money) • Elwha River: (NOAA Restoration $) • Lewis River: PacifiCorp $
Elwha Dam Glines Canyon Dam