Download
1 / 48
480 likes | 648 Vues
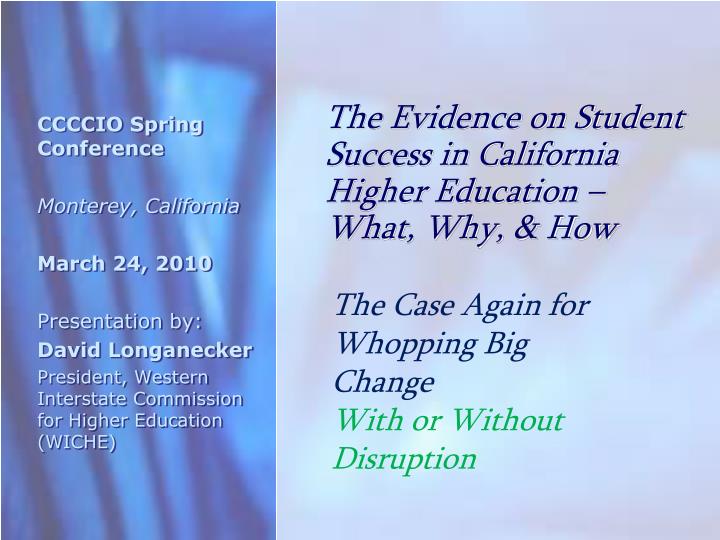
CCCCIO Spring Conference Monterey, California March 24, 2010 Presentation by: David Longanecker President, Western Interstate Commission for Higher Education (WICHE). The Evidence on Student Success in California Higher Education –What, Why, & How. The Case Again for Whopping Big Change

E N D
CCCCIO Spring Conference Monterey, California March 24, 2010 Presentation by: David Longanecker President, Western Interstate Commission for Higher Education (WICHE) The Evidence on Student Success in California Higher Education –What, Why, & How The Case Again for Whopping Big Change With or Without Disruption
Why Whopping Big Change Is Required • Total Quality Management – Continuous Improvement • Booz-Allen: Stable State Management System • Not a crisis management strategy • Your challenge • 50 percent productivity gain almost immediately • Productivity gain = Quality improvement
The Case for Change • AASCU’s TOP ISSUES Revised • The Fiscal Crisis: State Support, Tuition Policy & Prices, Student Aid • Student Access & Success: Enrollment Capacity, Veterans Education, the Graduation Initiative • Educational Improvement: College Readiness, Focus on Community Colleges, & Teacher Effectiveness • Accountability: Data Systems and Reporting Metrics.
The Case for Change • AASCU’s TOP ISSUES Revised • The Fiscal Crisis: State Support, Tuition Policy & Prices, Student Aid • Student Access & Success: Enrollment Capacity, Veterans Education, the Graduation Initiative • Educational Improvement: College Readiness, Focus on Community Colleges, & Teacher Effectiveness • Accountability: Data Systems and Reporting Metrics.
The Case for Change • AASCU’s TOP ISSUES Revised • The Fiscal Crisis: State Support, Tuition Policy & Prices, Student Aid • Student Access & Success: Enrollment Capacity, Veterans Education, the Graduation Initiative • Educational Improvement: College Readiness, Focus on Community Colleges, & Teacher Effectiveness • Accountability: Data Systems and Reporting Metrics.
The Case for Change • AASCU’s TOP ISSUES Revised • The Fiscal Crisis: State Support, Tuition Policy & Prices, Student Aid • Student Access & Success: Enrollment Capacity, Veterans Education, the Graduation Initiative • Educational Improvement: College Readiness, Focus on Community Colleges, & Teacher Effectiveness • Accountability: Data Systems and Reporting Metrics.
The Case for Change • AASCU’s TOP ISSUES Revised • The Fiscal Crisis: State Support, Tuition Policy & Prices, Student Aid • Student Access & Success: Enrollment Capacity, Veterans Education, the Graduation Initiative • Educational Improvement: College Readiness, Focus on Community Colleges, & Teacher Effectiveness • Accountability: Data Systems and Reporting Metrics.
The Case for Whopping Big Change An Emerging Perfect Storm • Wave One: Our Economic Competitiveness • Wave Two: Who We Are – Can We Be Competitive • Wave Three: What We Have in Resources
The Liberal Borrowings • Knocking on the College Door (WICHE) • Beyond Social Justice (WICHE) • National Center for Higher Education Management Systems (NCHEMS) : www.higheredinfo.org. • State Higher Education Executive Officers (SHEEO), SHEF Report, February 2010.
The Converging Waves • Wave One: Our Economic Competitiveness • Wave Two: Who We Are – Can We Be Competitive • Wave Three: What We Have in Resources
AK NV MI RI FL GA OH PA VT KS NC MO ME NE ID NM Relationship Between Educational Attainment, Personal Income, and Economic Strength $30,000 High Income, Low Educational Attainment High Income, High Educational Attainment CT State New Economy Index (2002) Top Tier Middle Tier NJ Low Tier MA MD $25,000 CO VA NH NY DE MN IL WA CA Personal Income Per Capita, 2000 US HI WI OR IN AZ $20,000 IA TX TN WY SC AL UT KY ND OK SD MT LA AR WV MS Low Income, Low Educational Attainment Low Income, High Educational Attainment $15,000 15% 20% 25% 30% 35% 40% Percent of Adults Age 25-64 with a Bachelor’s Degree or Higher
Percent of Population Ages 25-64 with a Bachelor’s Degree or Higher Source: U.S. Census Bureau, 2007 American Community Survey. Via NCHEMS
Percent of Population Ages 25-64 with an Associate Degree Source: U.S. Census Bureau, 2007 American Community Survey. Via NCHEMS
Differences in College Attainment (Associate and Higher) Between Younger and Older Adults - U.S. and OECD Countries, 2005 Source: Organisation for Economic Co-operation and Development (OECD), Education at a Glance 2007
Differences in College Attainment (Associate and Higher) Between Younger and Older Adults - U.S., 2005 Source: U.S. Census Bureau, 2005 ACS
The White Caps on the First Wave • We’ve Been A Leader • But Slip-Sliding Away • Losing Ground: • The West, and California in particular, are the U.S. Problem • Falling Internationally
The Unique CCCCIO Challenges/Opportunities: Making Wave One, Wave Won • With Respect to College Entry • Not so bad – clear state Mission • Placement has not been synchronized • But underway • Think Common Core • Low hanging fruit – Adults With Some College But No Degree • 4.4 Million – 22.7% of Adults in California • Ramp up Production of High Value Certificates
The Unique CCCCIO Challenges/ Opportunities:Making Wave One, Wave Won • With Respect to Progression Through College • Need higher thru put: More Transfer and Terminal Associate Degrees • The Good News (or so it seems): Transfer and Articulation progressing • Consider more aggressive remunerated coop work study programs • Focus on being adult friendly – use CAEL’s ALFI assessment. • Eliminate time as the enemy • Less is more – a default curriculum • Guaranteed curriculum if full-time/on-time
The Unique CCCCIO Challenges/ Opportunities:Making Wave One, Wave Won • With Respect to Completion • Same/same as progression • Plus: • Accept legitimate Prior Learning Assessment (PLA) • Better Yet: Encourages PLA • Do Degree Audits & Grant Degrees Where Appropriate (Win/Win Project) • Intentionally partner with non-public institutions • (Yup; I mean private for and not for profit places) • Triage almost demands this
The Converging Waves • Wave One: Our Economic Competitiveness • Wave Two: Who We Are – Can We Be Competitive • Wave Three: What We Have in Resources
High School Graduation Rates - Public High School Graduates as a Percent of 9th Graders Four Years Earlier, 2006 Source: Tom Mortenson, Postsecondary Opportunity Via NCHEMS
College-Going Rates – First-Time Freshmen Directly Out of High School as a Percent of Recent High School Graduates, 2006 Source: Tom Mortenson, Postsecondary Opportunity Via NCHEMS
Difference Between Whites and Next Largest Race/Ethnic Group in Percentage of Adults Age 25-34 with an Associate Degree or Higher, 2000 Source: U.S. Census Bureau, PUMS (based on 2000 Census), Via NCHEMS
Patterns of U.S. High School and College Participation and Completion by Age (Average Annual from 2005 to 2007) Not Much Happens After the Age of 24 100% High School Participation Earn High School Diploma or Equivalent – Levels off at Age 21 80% We are left with 13 percent of adults with no high school diploma, and 60 percent with no college degree. 60% Undergraduate College Participation – Peaks at Age 19, Levels off at Age 30 Complete Undergraduate College Degree – Peaks and Levels off at Age 31 40% 20% 0% 16 17 18 19 20 21 22 23 24 25 26 27 28 29 30 31 32 33 34 35 36 37 38 39 40 AGE Note: Includes associate and bachelor’s degrees, but not certificates. Source: U.S. Census Bureau, 2005-07 American Community Survey (Public Use Microdata Sample)
The White Caps on the Second Wave • Those with whom we have succeeded are declining • Those with whom we have not succeeded are increasing • “Average” won’t sustain us, and may not even be achievable
The Unique CCCCIO Opportunities/ Challenges: Wave Two, Too, Being Won • With respect to College Entry • Much the same as with Wave Won • Improve Placement – build on Common Core • Think “Adults with some college, no degree” • Market research & intention works here • Think high-value certificates • Even post-bachelaureate – i.e. Red Rocks PA program • Demand evidence as basis for chage, but • Be willing to adapt rapidly – tradition is your enemy here
The Unique CCCCIO Opportunities/ Challenges: Wave Two, Too, Being Won • With respect to Progression • REINVENT REMEDIATION • Problem is not what we call it; it’s how we do it • Approaches to consider • Technology blended (National Center for Academic Transformation) • Replace prerequisites with co-requisites • Modularized self-paced instruction • Nix Learning Communities for this purpose • Know thyself – get the evidence • By: race/ethnicity, major, gateway courses, etc.
The Unique CCCCIO Opportunities/ Challenges: Wave Two, Too, Being Won • With respect to Progression • Many of the same as with Wave Won • Improve transfer/articulation (under way) • Coop work study • Adult friendly • Garner greater student commitment through incentives – incentivize full-time, continuity (again, time is everyone’s enemy) • Develop Cohort approach • (and backup cohort) • Streamline curriculum – less is more • Default curriculum • STEM specific curriculum
The Unique CCCCIO Opportunities/ Challenges: Wave Two, Too, Being Won • With respect to Completion • Same As Wave Won • Encourage PLA • Degree Audits • Partner with non-public sector institutions • Reward Steps Along The Way – Momentum Points. • Mine your data • To prevent dropouts • To re-attract recent dropouts
The Converging Waves • Wave One: Our Economic Competitiveness • Wave Two: Who We Are – Can We Be Competitive • Wave Three: What We Have in Resources
Life could have been worse Public FTE Enrollment, Educational Appropriations, and Total Educational Revenue per FTE, U.S., Fiscal 1985-2010 $14,000 14.0 $12,000 12.0 $3,278 10.0 $10,000 $3,293 $3,384 $3,428 $3,387 $3,337 $3,431 $3,288 $4,027 $2,469 $3,375 $2,403 $2,575 $2,518 $3,348 $3,419 $4,116 $3,982 $2,341 $4,068 $3,343 $4,108 $2,434 $2,657 $3,387 $2,550 $3,230 $3,271 $4,178 $3,356 $3,891 $2,608 $2,371 $3,760 $2,691 $2,866 $2,245 $3,146 $3,146 $4,321 $2,274 $3,360 $3,043 $2,501 $3,718 $3,611 $3,431 $2,903 $3,186 $3,524 $3,082 8.0 $8,000 Public FTE Enrollment (millions) Dollars per FTE 6.0 $6,000 $7,682 $7,979 $7,988 $7,869 $7,825 $7,607 $8,035 $7,993 $4,000 4.0 $7,961 $7,171 $7,770 $7,855 $7,211 $7,547 $6,912 $7,311 $6,951 $7,325 $6,994 $6,454 $7,227 $7,479 $7,195 $6,740 $6,662 $6,986 2.0 $2,000 $0 0 2010 1985 1986 1987 1988 1989 1990 1991 1992 1993 1994 1995 1996 1997 1998 1999 2000 2001 2002 2003 2004 2005 2006 2007 2008 2009 Educational Appropriations per FTE (constant $) Net Tuition Revenue per FTE (constant $) Public FTE Enrollment (millions) Note: Net tuition revenue used for capital debt service is included in the above figures. All figures are adjusted by SHEEO Higher Education Cost Adjustment (HECA).Source: SHEEO SHEF 2010.
Same trend; lower amounts in CA Public FTE Enrollment, Educational Appropriations and Total Educational Revenue per FTE, California, Fiscal 1985-2010 10.0 $12,000 $10,000 8.0 $947 $1,445 $949 $988 $878 $932 $873 $1,419 $974 $1,013 $1,506 $917 $949 $1,198 $1,445 $899 $8,000 $1,467 $1,487 $1,562 $1,598 $1,230 $1,687 $1,457 $1,649 $1,404 6.0 $1,814 Public FTE Enrollment (thousands) Dollars per FTE $6,000 4.0 $8,730 $8,534 $8,302 $8,292 $8,302 $8,240 $8,293 $8,026 $7,961 $4,000 $7,773 $7,741 $7,596 $7,682 $7,546 $7,393 $7,404 $7,095 $7,204 $7,227 $7,132 $6,929 $6,815 $6,690 $6,585 $6,486 $6,065 2.0 $2,000 0 $0 2010 1985 1986 1987 1988 1989 1990 1991 1992 1993 1994 1995 1996 1997 1998 1999 2000 2001 2002 2003 2004 2005 2006 2007 2008 2009 Educational Appropriations per FTE (constant $) Net Tuition Revenue per FTE (constant $) Public FTE Enrollment (millions) Note: Constant 2009 dollars adjusted by SHEEO Higher Education Cost Adjustment. 2009 Educational Appropriations include ARRA funds. (HECA) Source: SSDB
Revenues Per Student from Net Tuition, State, & Local Appropriations Public Research Sources: NCES, IPEDS 2006-07 Finance Files; f0607_f1a and f0607_f2 Final Release Data Files. NCES, IPEDS 2007-08 Institutional Characteristics File; hd2007 Final Release Data File. NCES, IPEDS 2006-07 Enrollment Files; ef2006a, effy2007, and efia2007 Final Release Data Files. Via NCHEMS
Revenues Per Student from Net Tuition, State, & Local Appropriations Public Masters and Baccalaureate Sources: NCES, IPEDS 2006-07 Finance Files; f0607_f1a and f0607_f2 Final Release Data Files. NCES, IPEDS 2007-08 Institutional Characteristics File; hd2007 Final Release Data File. NCES, IPEDS 2006-07 Enrollment Files; ef2006a, effy2007, and efia2007 Final Release Data Files. Via NCHEMS
Revenues Per Student from Net Tuition, State, & Local AppropriationsPublic 2-Year Sources: NCES, IPEDS 2006-07 Finance Files; f0607_f1a and f0607_f2 Final Release Data Files. NCES, IPEDS 2007-08 Institutional Characteristics File; hd2007 Final Release Data File. NCES, IPEDS 2006-07 Enrollment Files; ef2006a, effy2007, and efia2007 Final Release Data Files. Via NCHEMS
Projected State and Local Budget Surplus (Gap) as a Percent of Revenues, 2016 Source: NCHEMS; Don Boyd (Rockefeller Institute of Government), 2009 Via NCHEMS
State Tax Capacity & EffortIndexed to U.S. Average 1.7 DE 1.6 1.5 1.4 CT NJ 1.3 MA AK 1.2 WY State Tax Capacity (Total Taxable Resources Per Capita) MD NY VA NH 1.1 MN CO IL NV WA CA RI 1.0 US PA NE WI NC GA KS HI MO SD IA OH FL IN VT TX OR 0.9 TN AZ ND ME MI UT SC KY 0.8 ID NM LA AL OK WV MT AR 0.7 MS 0.6 0.6 0.8 1.0 1.2 1.4 State Tax Effort (Effective Tax Rate) Source: State Higher Education Executive Officers (SHEEO)
Productivity: Total Funding per Degree/Certificate (Weighted*, 2006-2007) *Adjusted for value of degrees in the state employment market (median earnings by degree type and level) Sources: SHEEO State Higher Education Finance Survey 2008; NCES, IPEDS Completions Survey; U.S. Census Bureau, American Community Survey (Public Use Microdata Samples)
The White Caps on the Third Wave • Prospects look bleak for much more in the short term • New Normal suggests a very different future than past. • Triage often sacrifices the most vulnerable
The Unique CCCCIO Challenges/Opportunities: Wave Three – Show me the money • With respect to Entry into College • Tuition revenue, done smartly, is most of the answer • Balanced by financial aid is key • With respect to Progression through College • Tuition and financial aid remain key • Revise the rewards to focus on student success • Pay only for successful remediation – regardless of modality used • Pay only for completed courses -- tough love
The Unique CCCCIO Challenges/Opportunities: Wave Three – Show me the money With respect to Completion • Know thyself – focus on gaps, not successes • Clearly articulated pathways reduce student and state costs • Don’t enroll students in course that don’t articulate to their degree goals • Price by priority • Currently in place for resident/non-resident • Why not for core vs luxury/high vs low-value • Streamline programs – dropping the duds • Where academic success is too low to justify • Where ROI is too low to justify • Outsourcing or Pairing
The California story – Three Huge Converging Waves -- The Makings of A Perfect Storm • Demographics present a challenge, all else being equal • The finances are perilous • We have been educationally competitive, which has made us economically competitive and comparative just, but: • Were slipping • And the good life has not been equitably distribute
Creating a New Business Model – What I Hear & See • Who Will Lead – Academic Leaders or Other Leaders? • From the Community College “Community” • ACCT: Governance Institute for Student Success. • Foundations: • Achieving the Dream – top down through data driven reform, and limited success to date • Completion by Design – still in design • ____________ -- meet the goal
Creating a New Business Model – What I Hear & See • TRIAGE happens, whether intentional or not. • Lack of course availability • Low success rates • In remedial/developmental • In college level coursework • Particularly in STEM field • And indefensibly biased by race/ethnicity • Justifiable within current business model • Can’t afford more courses • Can’t support resources necessary for course success • But unjustifiable in support of Mission • So must create a new business model • Is that possible? • Disruptive technologies theory says no • We can’t live with that
Creating a New Business Model – Dave’s Nine Tenets of A New Way • Evidence based – data driven • Improvement imperative – Whopping big in the short term, continuous improve-ment, on benchmarks achieved. • Well, nearly continuous improvement. Recognize periodic perturbations. • Take reasonable risk & expect some failure.
Creating a New Business Model – Tenets of A New Way • Eliminate what can’t be done well enough. • Be genius – borrow generously. • Follow the CASEstudy approach • Reward success and champions of success (make performance count for regular folk). • Make this work fun • We work live, not live to work. • Don’t have too many tenets
That’s all there is Enough Already