Download
1 / 53
530 likes | 666 Vues
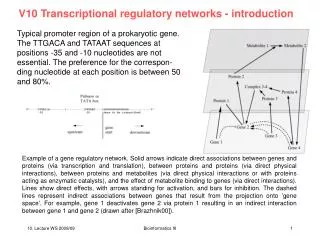
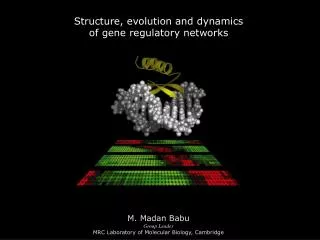
Adaptive evolution in prokaryotic transcriptional regulatory networks. M. Madan Babu, PhD. NCBI, NLM National Institutes of Health. Network. Metabolic. Protein Interaction. Transcriptional. Proteins. Nodes Links. Metabolites. Transcription factor Target genes. Enzymatic

E N D
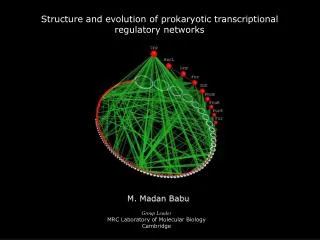
Adaptive evolution in prokaryotic transcriptional regulatory networks M. Madan Babu, PhD NCBI, NLM National Institutes of Health
Network Metabolic Protein Interaction Transcriptional Proteins Nodes Links Metabolites Transcription factor Target genes Enzymatic conversion Physical Interaction Transcriptional Interaction Protein-Protein Protein-Metabolite Interaction Protein-DNA A A A A B B B B Networks in Biology
Outline Structure of the transcriptional regulatory network Components, local & global structure Evolution of the regulatory network across organisms Evolution of components in the network (genes and interactions) Evolution of local network structure (motifs) Evolution of global network structure (scale-free structure)
Outline Structure of the transcriptional regulatory network Components, local & global structure Evolution of the regulatory network across organisms Evolution of components in the network (genes and interactions) Evolution of local network structure (motifs) Evolution of global network structure (scale-free structure)
Transcription factor Target gene Motifs (Local level) patterns of Interconnections Uri Alon & Rick Young Basic unit (Components) transcriptional interaction Scale free network (Global level) all transcriptional interactions in a cell Albert & Barabasi Structure of the transcriptional regulatory network Madan Babu M, Luscombe N, Aravind L, Gerstein M & Teichmann SA Current Opinion in Structural Biology (2004)
Local level: Transcriptional networks are made up of motifs which perform information processing task Global level: Transcriptional networks are scale-free conferring robustness to the system Properties of transcriptional networks
Single input Motif Multiple input Motif Feed Forward Motif ArgR TrpR TyrR Crp AroL AroM AraBAD ArgD AraC ArgE ArgF - Co-ordinates expression - Enforces order in expression - Quicker response - Integrates different signals - Quicker response Function - Responds to persistent signal - Filters noise Transcriptional networks are made up of motifs Network Motif “Patterns of interconnections that recur at different parts and with specific information processing task” Shen-Orr et. al. Nature Genetics(2002) & Lee et. al. Science (2002)
1 N (k) a g k Transcriptional networks are scale-free Scale-free structure Presence of few nodes with many links and many nodes with few links Scale free structure provides robustness to the system Albert & Barabasi, Rev Mod Phys (2002)
Tolerant to random removal of nodes (mutations) Vulnerable to targeted attack of hubs (mutations) – Drug targets Hubs are crucial components in such networks Scale-free networks exhibit robustness Robustness – The ability of complex systems to maintain their function even when the structure of the system changes significantly Haiyuan Yu et. al. Trends in Genetics (2004)
Summary I - Structure Transcriptional networks are made up of motifs that have specific information processing task Transcriptional networks are scale-free which confers robustness to such systems, with hubs assuming importance Madan Babu M, Luscombe N et. al Current Opinion in Structural Biology (2004)
Outline Structure of the transcriptional regulatory network Components, local & global structure Evolution of the regulatory network across organisms Evolution of components in the network (genes and interactions) Evolution of local network structure (motifs) Evolution of global network structure (scale-free structure)
Evolving interactions Evolving interactions Change in environment Change in environment Evolution of networks across organisms Ancestral network In a particular environment How does the regulatory network change during the course of organismal evolution ?
Dataset E. coli transcriptional regulatory network 112 TFs 711 TGs 1295 Interactions Salgado et al (2002) Nucleic Acids Research Shen-orr et al (2002) Nature Genetics Madan Babu & Teichmann (2003) Nucleic acids Research
Genome of interest Genome of interest Step 2 Step 3 Reconstruct interactions if orthologous TFs and TGs exist in the genome of interest and are known to interact in E. coli Identify orthologs in the genome of interest Procedure to reconstruct regulatory network E. coli Step 1 Define TFs and TGs Similar to Yu H et. al, Genome Research (2004) Verified with COGS, Tatusov, Koonin, Lipman,Science (1998)
Bacillus anthracis A2012 (5544 genes) Streptomyces coelicolor (7769 genes) 38 41 250 251 314 326 12 49 171 156 78 100 Reconstructed transcriptional networks 175 completely sequenced prokaryotic genomes 20 Archaeal, 156 Bacterial Genomes http://www.mrc-lmb.cam.ac.uk/genomes/madanm/reconstruct_net
175 completely sequenced prokaryotic genomes 20 Archaeal 156 Bacterial Genomes http://www.mrc-lmb.cam.ac.uk/genomes/madanm/reconstruct_net
Evolving interactions Evolving interactions Change in environment Change in environment Evolution of networks across organisms Ancestral network In a particular environment How do regulatory interactions change during the course of organismal evolution ?
Network (all transcriptional interactions in a cell) Selection can operate at three levels of organization Transcription factor Target gene Motifs (patterns of interconnections) Interactions (transcriptional interaction) Madan Babu M, Luscombe N et. al Current Opinion in Structural Biology (2004)
Network (all transcriptional interactions in a cell) Evolution of the basic unit Transcription factor Target gene Motifs (patterns of interconnections) Interactions (transcriptional interaction) Madan Babu M, Luscombe N et. al Current Opinion in Structural Biology (2004)
Independent evolution Co-evolution Transcription factors and target genes may co-evolve or evolve independently of each other Work on protein interaction network has shown that interacting proteins tend to co-evolve
Transcription factors present(%) Target genes present (%) Transcription factors evolve rapidly and independently of their target genes Does not mean they lose transcription factors Instead they evolves their own set of regulators
S. coelicolor B. japonicum B. pertussis B. bronchiseptica B. parapertussis Transcription factors D. hafniense M. magnetotacticum N. punctiforme Nostoc Sp Pirellula_sp Escherichia coli K12 (4311 genes) Bacillus anthracis A2012 (5544 genes) Streptomyces coelicolor (7769 genes) L. interrogans Winged HTH 111 Winged HTH 226 Winged HTH 96 39 200 Classical prokaryotic HTH Classical prokaryotic HTH Classical prokaryotic HTH 42 C-terminal effector domain C-terminal effector domain 45 C-terminal effector domain 142 39 Proteome size Cro/C1 type HTH Cro/C1 type HTH Cro/C1 type HTH 47 87 25 FIS like FIS like FIS like 1 6 13 Predicted Transcription Factors from the different genomes Nimwegen, TIGS (2003); Renea et. al, JMB (2004); Aravind et. al, FEMs letters (2005)
Transcription Factor conservation profile Can be used to predict presence/absence of specific response regulatory pathways
Interaction conservation profile organism A interaction 0001: yes interaction 0002: yes interaction 0003: yes interaction 0004: no interaction 0005: yes interaction 0006: no . . interaction 1295: yes organism B interaction 0001: yes interaction 0002: no interaction 0003: yes interaction 0004: yes interaction 0005: yes interaction 0006: no . . interaction 1295: yes organism Z interaction 0001: no interaction 0002: no interaction 0003: no interaction 0004: yes interaction 0005: yes interaction 0006: no . . interaction 1295: no ..... H G A interaction 1 2 3 4 5 6 . . 1295 organism A 1 1 1 0 1 0 . . 1 organism B 1 0 1 1 1 0 . . 1 . organism Z 0 0 0 1 1 0 . . 0 B F C E D Do organisms with similar lifestyle conserve similar interactions ? Procedure to construct tree based on similarity of conserved networks
Distance tree based on interactions present Tree based on network similarity Closely related organisms with similar lifestyle cluster together Organisms with similar lifestyle but belonging to different phylogenetic groups cluster together
Lifestyle similarity index Define a lifestyle class for each of the 176 organism based on 4 attributes Oxygen requirement Optimal growth temperature Habitat Pathogen or not e.g: E. coli would belong to the class: Facultative:Mesophilic:Host-associated:No Each cell represents Average similarity in interaction content between organisms
Lifestyle similarity index LSI = 1.42 p-value < 10-3 Organisms with similar lifestyle conserve similar interactions
Summary I - Evolution of the basic unit Transcription factors tend to evolve rapidly than their target genes. This coupled with the observation that different genomes evolve their own transcription factors means that they sense and respond to different signals in their environment. At the level of regulatory interactions, organisms with similar lifestyle conserve similar regulatory interactions indicating the influence of environment on gene regulation.
Network (all transcriptional interactions in a cell) Evolution of network motifs across organisms Transcription factor Target gene Motifs (patterns of interconnections) Interactions (transcriptional interaction) Madan Babu M, Luscombe N et. al Current Opinion in Structural Biology (2004)
Complete conservation or absence Partial conservation Interactions in motifs may be conserved as a unit or may evolve like any other interaction in the network Work on protein interaction network has shown that motifs tend to be completely conserved
Motifs E. coli 0% 100% Genomes Partially conserved motifs Motifs are only partially conserved in many genomes
Are interactions in motifs more conserved than other interactions in the network? Simulation of network evolution Positive selection for interactions in motifs Interactions in motifs are selectively conserved Neutral selection for interactions in motifs Interactions in motifs are neutrally conserved Negative selection for interactions in motifs Interactions in motifs are selected against
Selection for motifs Observed trend in genomes Neutral conservation of motifs Selection against motifs Interactions in motifs evolve like any other interaction in the network
Evolutionarily closely related organisms that have dissimilar lifestyle do not conserve network motifs Fnr NuoN NarL Xylella fastidiosa (g proteobacteria) Haemophilus somnus (g proteobacteria) Vibrio cholerae (g proteobacteria) Blochmannia floridanus (g proteobacteria) Salmonella typhi (g proteobacteria) Evolutionarily distantly related organisms that have similar lifestyle conserve network motifs Fnr NarL R. palustris (a proteobacteria) B. pertussis (b proteobacteria) N. punctiforme (Cyanobacteria) S. avermitilis (Actinobacteria) D. hafniense (Firmicute)
Interactions in motifs evolve like any other interaction in the network Single input motif Feed forward motif E. coli stable environment – requires persistent signal H. influenzae unstable environment – requires quick response Responds to persistent signal Quick response Orthologous genes can be embedded in different motifs according to requirements dictated by lifestyle
Lifestyle similarity index Define a lifestyle class for each of the 176 organism based on 4 attributes Oxygen requirement Optimal growth temperature Habitat Pathogen or not e.g: E. coli would belong to the class: Facultative:Mesophilic:Host-associated:No Each cell represents Average similarity in motif content between organisms
Lifestyle similarity index Organisms with similar lifestyle conserve network motifs and hence may regulate target genes in a similar manner LSI = 1.34 p-value < 3x10⁻³ Organisms with similar lifestyle conserve network motifs and hence may regulate target genes in a similar manner
Summary II - Evolution of network motifs Even though motifs are not conserved as whole units, organisms with similar lifestyle tend to conserve similar motifs
Network (all transcriptional interactions in a cell) Evolution of global structure Transcription factor Target gene Motifs (patterns of interconnections) Interactions (transcriptional interaction) Madan Babu M, Luscombe N et. al Current Opinion in Structural Biology (2004)
Conservation of hubs Replacement of hubs Regulatory hubs may be conserved or lost and replaced Work on protein interaction network has shown that hubs tend to be conserved
Are hubs more conserved than other nodes in the network? Simulation of network evolution Positive selection for hubs Hubs in networks are selectively conserved Neutral selection for nodes Nodes in networks are neutrally conserved Negative selection for hubs Hubs in networks are are selected against
Regulatory hubs are lost as rapidly as other transcription factors in the network
Regulatory hubs which are condition specific can be either lost or replaced Crp Crp Crp NarL NarL NarL B. pertussis H. influenzae E. coli The same protein in organisms living in different lifestyles may confer different adaptive value. Hence it may emerge as a regulatory hub in the organism to which it confers high adaptive value and not in the others Different proteins should emerge as hubs in organisms with different lifestyle
Different proteins emerge as regulatory hubs Known transcriptional regulatory network of B. subtilis Known transcriptional regulatory network of E. coli CcpA (85) Crp (188) ComK (48) Fnr (109) AbrB (41) Ihf (95) Fur (37) ArcA (69) PhoP (33) NarL (65) CodY (30) Lrp (52) Scale-free structure emerged independently in evolution Hubs evolve according to requirements dictated by life style
Summary III - Evolution of global structure Even though hubs can be lost or replaced, organisms with different lifestyle evolve a scale-free structure where different proteins emerge as hubs as dictated by their lifestyle
Implications First overview of transcriptional regulatory systems, including prediction of transcription factors, in experimentally intractable organisms and pathogens Good starting point to study how changes in cis-regulatory elements affect gene expression experimentally and in engineering regulatory interactions Methods developed are generically applicable Identification of key regulatory hubs can possibly serve as good drug targets
Conclusion Transcription factors evolve independently of their target genes Organisms with similar lifestyle conserve similar interactions Interactions in motifs are not conserved as whole units Organisms with similar lifestyle conserve similar motifs Hubs are not completely conserved and can be lost or replaced Different proteins emerge as hubs in organisms as dictated by lifestyle Transcriptional networks in prokaryotes are flexible and adapt to their environment by tinkering individual interactions
Acknowledgements Sarah Teichmann MRC-LMB, Cambridge, U.K L Aravind NCBI, NIH, Bethesda, USA MRC - Laboratory of Molecular Biology National Institutes of Health Evolutionary dynamics of prokaryotic transcriptional regulatory networks Madan Babu M, Teichmann, SA & Aravind L, submitted http://www.mrc-lmb.cam.ac.uk/genomes/madanm/publications.html
Growth of transcriptional regulatory networks Condition specific usage of transcriptional regulatory networks Evolution of transcription factors duplication of TG duplication of TF duplication of TG + TF Teichmann SA & Madan Babu M Nature Genetics (2004) Luscombe N, Madan Babu M et. al Nature (2004) Madan Babu M & Teichmann SA Nucleic Acids Research (2003) Trends in Genetics (2003) Past work from our lab