Download
1 / 26
260 likes | 414 Vues
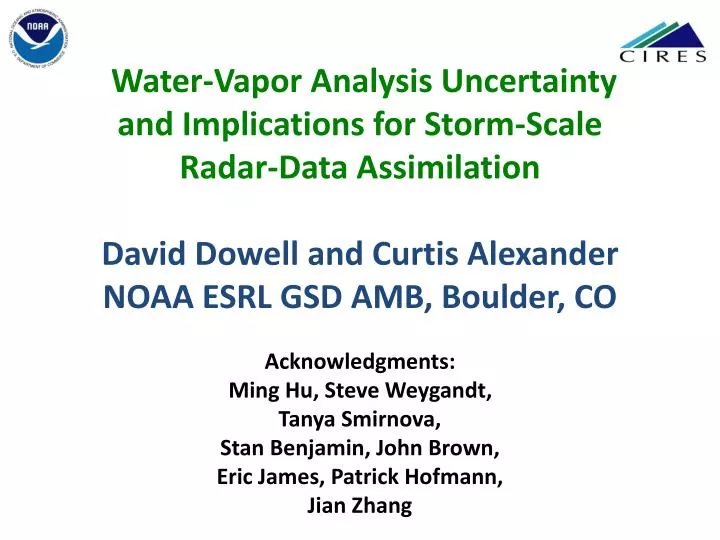
Water-Vapor Analysis Uncertainty and Implications for Storm-Scale Radar-Data Assimilation David Dowell and Curtis Alexander NOAA ESRL GSD AMB, Boulder, CO Acknowledgments: Ming Hu, Steve Weygandt, Tanya Smirnova, Stan Benjamin, John Brown, Eric James, Patrick Hofmann, Jian Zhang.

E N D
Water-Vapor Analysis Uncertaintyand Implications for Storm-ScaleRadar-Data AssimilationDavid Dowell and Curtis AlexanderNOAA ESRL GSD AMB, Boulder, COAcknowledgments:Ming Hu, Steve Weygandt, Tanya Smirnova, Stan Benjamin, John Brown, Eric James, Patrick Hofmann,Jian Zhang
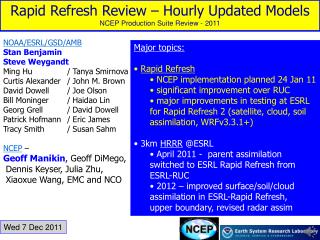
Hourly Updated NOAA NWP Models Rapid Refresh (RR) replaces RUC at NCEP in 2011 WRF, GSI with RUC features 13km Rapid Refresh (mesoscale) 13km RUC (mesoscale) 3km HRRR (storm-scale) RUC – current oper Model, new 18h fcst every hour High-Resolution Rapid Refresh Experimental 3km nest inside RR, new 15-h fcst every hour
HRRR Reflectivity Verification Eastern US, Reflectivity > 25 dBZ 11-20 August 2011 BIAS 03 km CSI 40 km RUC->HRRR Radar RR->HRRR Radar RR->HRRR No Radar RUC->HRRR No Radar Optimal RR->HRRR Radar RR->HRRR No Radar RUC->HRRR Radar RUC->HRRR No Radar Reflectivity DA in RR/RUC increases HRRR forecast skill HRRR bias depends strongly on parent model
more accuraterepresentation ofsystem maturity convection develops quickly (RR cycling, DDFI) obs 1-h fcstwithout 3-kmradar DA 1-h fcstwith 3-kmradar cycling 1-h fcstwith 3-kmradar DA CompositeReflectivity2100 UTC11 May 2011
more accurateforecast ofconvective system propagation obs 6-h fcstwithout 3-kmradar DA 6-h fcstwith 3-kmradar DA CompositeReflectivity0200 UTC11 May 2011
spurious convection spurious convection obs 6-h fcstwithout 3-kmradar DA 6-h fcstwith 3-kmradar DA CompositeReflectivity0200 UTC11 May 2011
Impressions from Reflectivity DataAssimilation on HRRR (x=3 km) Grid • Forecast skill from radar DA • Improvement in 00-03 hr forecasts • Little change in 06-12 hr forecasts • meso-/synoptic-scale forcing quickly dominates forecast? • Model inability to sustain some observed storms • Convective-scale model error • and/or storm-environment analysis error? • Spurious convective storms • Pervasive problem • Unclear solution on convective scale
Back to the Mesoscale • Rapid Refresh (RR) and Rapid Update Cycle (RUC) • Similarities: resolution (Dx=13 km), 3DVar DA, hourly cycling • Differences: resulting HRRR forecasts • How different are the RR and RUC mesoscale analyses? • Two realizations of a mesoscale analysis • Differences representative of analysis uncertainty? RR->HRRR No Radar RUC->HRRR No Radar Optimal BIAS 03 km
RR and RUC Temperature Bias CONUS All 00/12 UTC Raobs 08 July – 08 Sept 2011 00 hr (analysis) 12 hr fcsts RR RUC RR - RUC RR RUC RR - RUC Very small temperature bias in both RR and RUC
RR and RUC Humidity Bias CONUS All 00/12 UTC Raobs 08 July – 08 Sept 2011 00 hr (analysis) 06 hr fcsts RR RUC RR - RUC RR RUC RR - RUC RUC/RR drier/moister below 650 mb, opposite above RR a closer fit to the observations by 6 hrs in lower trop Water vapor is the dominant source of the RH bias
RR and RUC Humidity Bias CONUS All 00/12 UTC Raobs 11-22 August 2011 NO RADAR DA 00 hr (analysis) 06 hr fcsts RR RUC RR - RUC RR RUC RR - RUC Without radar DA, model bias even more pronounced
HRRR Water Vapor Histograms CONUS 11-22 August 2011 NO RADAR DA 0 hr forecasts Surface ~800 mb RUC-> HRRR higher RR-> HRRR higher RUC-> HRRR higher RR-> HRRR higher Differences large enough to affect convective forecasts
HRRR Reflectivity Verification Eastern US, Reflectivity > 25 dBZ 11-20 August 2011 NO RADAR DA 04 hr fcsts BIAS 03 km CSI 40 km Optimal Same Skill No difference RR->HRRR RUC->HRRR RR->HRRR – RUC->HRRR RR->HRRR RUC->HRRR RR->HRRR – RUC->HRRR
HRRR Reflectivity Verification Eastern US, Reflectivity > 25 dBZ 11-20 August 2011 NO RADAR DA 04 hr fcsts BIAS 03 km CSI 40 km Optimal Same Skill No difference RR->HRRR RUC->HRRR RR->HRRR – RUC->HRRR RR->HRRR RUC->HRRR RR->HRRR – RUC->HRRR
CompositeReflectivity0800 UTC13 Aug 2011 obs storm coverage somewhat underforecast (overforecast) in RUC->HRRR (RR->HRRR) 2-h fcstRUC->HRRR 2-h fcstRR->HRRR
Water Vapor Analyses 8 m AGL0600 UTC13 Aug 2011 RR – RUC difference storm coverage somewhat underforecast (overforecast) in RUC->HRRR (RR->HRRR) RUC->HRRR RR->HRRR
Water Vapor Analyses 2600 m AGL0600 UTC13 Aug 2011 RR – RUC difference storm coverage somewhat underforecast (overforecast) in RUC->HRRR (RR->HRRR) RUC->HRRR RR->HRRR
Analysis Vertical Profiles0600 UTC13 Aug 2011 RR->HRRR RUC->HRRR RR->HRRR
CompositeReflectivity1500 UTC14 Aug 2011 obs spurious convection in RR->HRRR 3-h fcstRUC->HRRR 3-h fcstRR->HRRR
Water Vapor Analyses 8 m AGL1200 UTC14 Aug 2011 RR – RUC difference location of spurious convection in RR->HRRR RUC->HRRR RR->HRRR
Water Vapor Analyses 600 m AGL1200 UTC14 Aug 2011 RR – RUC difference differences as much as 10 g/kg ! RUC->HRRR RR->HRRR
Analysis Vertical Profiles1200 UTC14 Aug 2011 RR->HRRR Observed Profile RUC->HRRR RR->HRRR
Water-Vapor Analysis • Small analysis differences near surface • Abundance of surface observations • Large analysis differences (several g/kg) at low levels above surface • Much larger than what is considered important for • convective-storm formation and evolution • Limited potential of storm-scale radar DA in the presence of large water-vapor analysis and forecast errors • Spurious convective storms • Model inability to sustain some observed storms • Reducing analysis uncertainty and bias • Radar and/or satellite data? • DA methods? => 3DVar cloud analysis; flow-dependent b. e. c. • Model improvements? => PBL scheme