Download
1 / 35
350 likes | 371 Vues
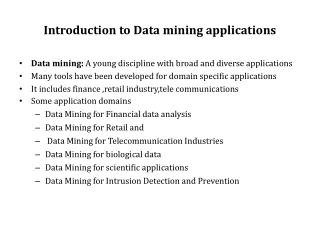
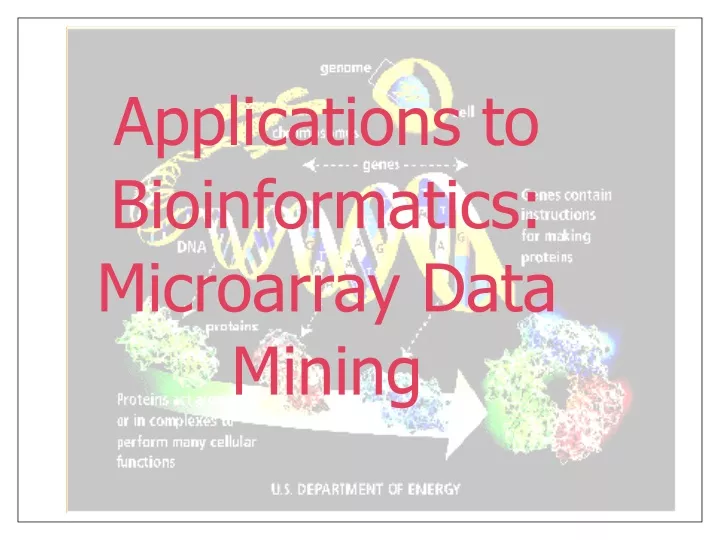
Applications to Bioinformatics: Microarray Data Mining. Overview. Gene Expression Microarrays - Overview Building Microarray Classification Models data preparation gene selection parameter tuning and cross-validation Project – Data Mining Competition. Biology and Cells.

E N D
Overview • Gene Expression Microarrays - Overview • Building Microarray Classification Models • data preparation • gene selection • parameter tuning and cross-validation • Project – Data Mining Competition
Biology and Cells • All living organisms consist of cells. • Humans have trillions of cells. Yeast - one cell. • Cells are of many different types (blood, skin, nerve), but all arose from a single cell (the fertilized egg) • Each* cell contains a complete copy of the genome (the program for making the organism), encoded in DNA. * there are a few exceptions
DNA • DNA molecules are long double-stranded chains; 4 types of bases are attached to the backbone: adenine (A) pairs with thymine (T), and guanine (G) with cytosine (C). • A gene is a segment of DNA that specifies how to make a protein. • Proteins are large molecules are essential to the structure, function, and regulation of the body. E.g. are hormones, enzymes, and antibodies. • E.g. Human DNA has about 30-35,000 genes; Rice -- about 50-60,000, but shorter genes.
Exons and Introns: Data and Logic? • exons arecoding DNA (translated into a protein), which are only about 2% of human genome • introns are non-coding DNA, which provide structural integrity and regulatory (control) functions • exons can be thought of program data, while introns provide the program logic • Humans have much more control structure than rice
Gene Expression • Cells are different because of differential gene expression. • About 40% of human genes are expressed at one time. • Gene is expressed by transcribing DNA exons into single-stranded mRNA • mRNA is later translated into a protein • Microarrays measure the level of mRNA expression
Molecular Biology Overview Nucleus Cell Chromosome Gene expression Gene (DNA) Gene (mRNA), single strand Protein Graphics courtesy of the National Human Genome Research Institute
Gene Expression Measurement • mRNA expression represents dynamic aspects of cell • mRNA expression can be measured with latest technology • mRNA is isolated and labeled with fluorescent protein • mRNA is hybridized to the target; level of hybridization corresponds to light emission which is measured with a laser
Gene Expression Microarrays The main types of gene expression microarrays: • Short oligonucleotide arrays (Affymetrix) – • 11-20 probes per gene, • probes for perfect match vs mismatch; • cDNA or spotted arrays (Brown/Botstein) • two colors – experiment vs control. • ...
50um Affymetrix Microarrays 1.28cm ~107 oligonucleotides, some perfectly match mRNA (PM), some have one Mismatch (MM) Gene expression computed from PM and MM
Affymetrix Microarray Raw Image Gene Value D26528_at 193 D26561_cds1_at -70 D26561_cds2_at 144 D26561_cds3_at 33 D26579_at 318 D26598_at 1764 D26599_at 1537 D26600_at 1204 D28114_at 707 raw data Scanner enlarged section of raw image
Microarray Potential Applications • Earlier and more accurate diagnostics • New molecular targets for therapy • Improved and individualized treatments • fundamental biological discovery (e.g. finding and refining biological pathways) • Recent examples • molecular diagnosis of leukemia, breast cancer, ... • discovery that genetic signature strongly predicts outcome • a few new drugs, many new promising drug targets
Microarray Data Analysis Types • Gene Selection • Find genes for therapeutic targets (new drugs) • Classification (Supervised) • Identify disease • Predict outcome / select best treatment • Clustering (Unsupervised) • Find new biological classes / refine existing ones • Exploration
Microarray Data Analysis Challenges • Few records (samples), usually < 100 • Many columns (genes), usually > 1,000 • This is very likely to result in false positives, “discoveries” due to random noise • Model needs to be explainable to biologists • Good methodology is essential for minimizing and controlling false positives
Microarray Classification Overview Train data Data Cleaning & Preparation Feature and Parameter Selection Class data Gene data Model Building Test data Evaluation
Data Preparation Issues • Cleaning: inherent measurement noise • Thresholding: • min 20, max 16,000 for MAS-4 • MAS-5 does not generate negative numbers • Filtering - remove genes with low variation (for biological and efficiency reasons) • e.g. MaxVal - MinVal < 500 and MaxVal/MinVal < 5 • or Std. Dev across samples in the bottom 1/3 • or MaxVal - MinVal < 200 and MaxVal/MinVal < 2
Gene Reduction improves Classification • Most learning algorithms look for non-linear combinations of features • Can easily find spurious combinations given few records and many genes – “false positives problem” • Classification accuracy improves if we first reduce number of genes by a linear method • e.g. T-values of mean difference • Select an equal number of genes from each class (heuristic) • Then apply favorite machine learning algorithm
Feature selection approach • Rank genes by measure & select top 100-200 • T-test for Mean Difference= • Signal to Noise (S2N) =
Class 178 105 4174 7133 2 1 1 2 T-value = -1.1 Measuring False Positives with Randomization Randomized Class CD37 antigen Class Randomization is Less Conservative Preserves inner structure of data 178 105 4174 7133 1 1 2 2 2 1 1 2 Randomize
Measuring False Positives with Randomization (2) Rand Class Gene Class 178 105 4174 7133 1 1 2 2 2 1 1 2 Randomize 500 times Gene Class Bottom 1% T-value = -2.08 Genes with T-value <-2.08 are significant at p=0.01 178 105 4174 7133 2 1 1 2
Multi-class classification • Simple: One model for all classes • Advanced: Separate model for each class
Iterative Wrapper approach to selecting the best gene set • Model with top 100 genes is not optimal • Test models using 1,2,3, …, 10, 20, 30, 40, ..., 100 top genes with cross-validation. • Gene selection: • Simple: equal number of genes from each class • advanced: best number from each class • For randomized algorithms (e.g. neural nets), average 10+ Cross-validation runs
Selecting Best Gene Set • Select gene set with lowest combined Error • good, but not optimal! Average, high and low error rate for all classes
Error rates for each class Error rate Genes per Class
Popular Classification Methods • Decision Trees/Rules • Find smallest gene sets, but not robust – poor performance • Neural Nets - work well for reduced number of genes • K-nearest neighbor – good results for small number of genes, but no model • Naïve Bayes – simple, robust, but ignores gene interactions • Support Vector Machines (SVM) • Good accuracy, does own gene selection, but hard to understand • …
Global Feature (Gene) Selection “Leaks” Information Gene Data Class data Train data Gene Selection Model Building Evaluation Test data is wrong, because the information is “leaked” via gene selection. When #Features >> # samples, leads to overly “optimistic” results.
Classification: External X-val Gene Data Train data Feature and Parameter Selection T r a i n Data Model Building class Evaluation Test data FinalTest Final Model Final Results
Microarrays: ALL/AML Example • Leukemia: Acute Lymphoblastic (ALL) vs Acute Myeloid (AML), Golub et al, Science, v.286, 1999 • 72 examples (38 train, 34 test), about 7,000 genes • well-studied (CAMDA-2000), good test example ALL AML Visually similar, but genetically very different
Gene subset selection: multiple cross-validation runs For ALL/AML data, 10 genes per class had the lowest error: (<1%) Point in the center of each bar is the average error from 10 cross-validation runs Bars indicate 1 st. dev above and below
ALL/AML: Results on the test data • Genes selected and model trained on Train set only • Best Net with 10 top genes per class (20 overall) was applied to the test data (34 samples): • 33 correct predictions (97% accuracy), • 1 error on sample 66 • Actual Class AML, Net prediction: ALL • other methods consistently misclassify sample 66 – may have been misclassified by a pathologist?
Multi-class Data Analysis • Brain data: Pomeroy et al 2002, Nature (415), Jan 2002 • 42 examples, about 7,000 genes, 5 classes Photomicrographs of tumours (400x) a, MD (medulloblastoma) classis b, MD desmoplastic c, PNET d, rhabdoid e, glioblastoma Analysis also used Normal tissue (not shown)
Multi-class Classification Results Point in the center of each bar is the average error from 10 cross-validation runs, using Clementine Neural Networks Bars indicate 1 st. dev above and below Best results with 12 genes per class – 15% error
Microarray Summary • Gene Expression Microarrays have tremendous potential in biology and medicine • Microarray Data Analysis is difficult and poses unique challenges • Capturing the entire Microarray Data Analysis Process is critical for good, reliable results
Final Project: Microarray Data Analysis • 92 pediatric tumor cases of 5 classes • MED, MGL, EPD, JPA, RHB • 7,070 genes (no controls) • Train set: 69 samples, labeled • Test set: 23 samples, unlabeled, similar class distribution • Goal: Predict classes in test set
Final Project: Scoring the test set • Use train set to develop best model parameters (number of genes, etc) by cross-validation • Use Weka: IB1, IBk, J4.8, NaiveBayes, ? • Use the same parameters to develop the final model on the entire train set and use it to score the final test set • Write a paper describing the experiment • Random label assignment: 8-11 correct of 23 • Final grade: effort, paper, correct assignment