Download
1 / 17
170 likes | 293 Vues
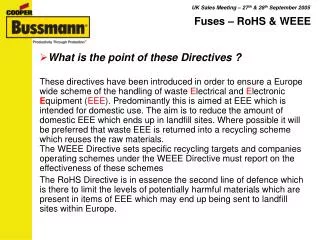
Household WEEE Generated in Italy. Presenter Name. Research supported by:. In partnership with. Challenges for the future. 65% PoM (3 preceeding years) Or 85% WG. 45% PoM (3 preceeding years). From 2019. 2016-2018. 4 kg/ab or Average 3 preceeding years. 2012-2015.

E N D
Household WEEE Generated in Italy PresenterName Researchsupported by: In partnership with
Challenges for the future 65% PoM (3 preceeding years) Or 85% WG 45% PoM (3 preceeding years) • From 2019 • 2016-2018 4 kg/ab or Average 3 preceeding years • 2012-2015
Starting Point (Eurostat 2010) Pre WEEE Directive WEEE Directive B2C B2B Target 31/12/2006 4 kg/inh
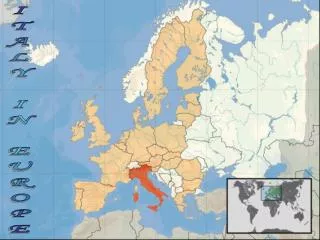
Italianstudy, Europeancontext • Methodology Consolidated: • Used in NL, BE, IT • WIP FR • Under Discussion ES • Focus Household R1-R4 but applicable to R5 & Prof. • Identified Critical Factors for: • Target Setting • Collection Target Achievement
Research Team • Rocco Mosconi • Alessandro Gobbi • Mattia Manzoni • Nando Pagnoncelli • Gabriella Scarcella • Andrea Alemanno • Irene Monti Federico Magalini Jaco Huisman Feng Wang
UNU-KEYS • C.N. • Prodcom • WEEE Forum Cat. • 5 WS • UNU KEY (58) • Model WG • 10 Cat. 1A • Functional view for products • Waste stream view • Link to International Statistics • Industrial Production (PRODCOM): 165 Codes on more than 9.400 (2011) • Import Export (Combined Nomenclature) 345 Codes on more than 3.800 (2011) • Modelling
The WEEE Generated Model Stock Life-Time Profiles PoM
PoM: B2C & B2B Kg/inh
Life-Time Profiles: Differences per UNU-KEY More influence of PoM on Generation Saturated MArkets DIFFERENT Products DIFFERENT Markets DIFFERENT Generation Inertia effect of past PoM Influence average weight Saturated Markets
Changes in Life-Time profiles:Washing Machine example Av. Lifespan
Household EEE Stock Kg/inh 29,7 p/ab 2,7 p/ab 24,6 p/ab 1 p/ab 1,4 p/ab
HouseholdEEE Stock Kg/inh > 20 kg/ab 6,6 kg/ab 8,4 kg/ab 3,5 kg/ab 2,6 kg/ab
The Model Consumers, because of social and technological factors, from time to time decide to dispose, according to different channels and ways, part of household stock that grew up because of purchase of new EEE (or used ones).
Implications on Target Setting Inertia PoM of past years CRT vs LCD Market Change in Average weight (CRT vs LCD)
WEEE Flows in weight(2011) Importance Municipal Collection Points (& Retailers) Relevant ReUse component Relevant share Bad Habit (& Uncertainty), mainly on Mixed (Small) WEEE