Download

1 / 33
330 likes | 447 Vues
Integrated Assessment: What’s it all about? R.C. Francis, J.E. Little, M. Dalton, J. Field, V Agostini, A. Femia. McEvoy (1996) describes a fishery system as interactions between an ecosystem, a group of people working (economy), and a system of social control (management).

E N D
Integrated Assessment:What’s it all about?R.C. Francis, J.E. Little, M. Dalton, J. Field, V Agostini, A. Femia
McEvoy (1996) describes a fishery system as interactions between an ecosystem, a group of people working (economy), and a system of social control (management)
What we ought to sustain when we approach fishery management is not the size of a particular stock nor even the prosperity of a particular harvesting group over the near or long term. Rather, the most important target is the long-term health of the interaction between nature, the economy, and the legal system. Arthur McEvoy. 1996
Let’s start with an ecosystem,and work outward towards those interactions
NCC: Trajectory of a Fishery 500 most marine mammal populations increasing 400 300 Catches (1000's metric tons) harbor seals depleted by bounty hunting 200 elephant seals commercially extinct intensive sea otter, fur seal, elephant seal harvest N. fur seals low 100 sea lions low intensive sea lion harvest 0 1800 1980 1850 1900 1950 2000 Crustaceans Salmon Groundfish Hake Pelagic Planktivores
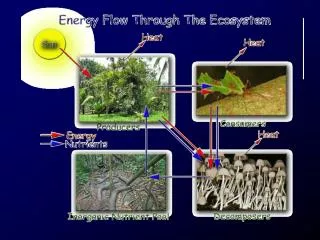
Ecosystem Services … consist of flows of materials, energy and information from natural capital stocks which combine with manufactured and human capital services to produce human welfare. Costanza et. al. 1997. Nature
How do we define the value of ecosystem services? • Usually applied directly to something that is marketed (direct connection between the ecosystem and the economy) • Must be applied marginally (what would society gain if a little more of the good were made available?)
How might we measure ecosystem value? • Production value • Standing stock value • Existence value
Harvest Respiration zoopl. fish Consumption Production Egestion to detritus
l Pl Qlj j Pj Qmj m Pm Qji i Pi n Pn Qnk k Pk Qok o Po
Production Value = [(Pi – SQji) * $Pi] S $ l Pl Qlj X j Pj $ Qmj m Pm Qji X i Pi $ n Pn X Qki Qnk k Pk $ Qok o Po
Climate drives the system from the bottom
There’s a tremendous influx of pelagic predators in the summer ? Winter Summer
Acoustic data from NMFS surveys 1998 Hake Distribution 2001 Hake Distribution
Total Production Value 500 400 300 $ (millions) 200 100 0 no PDO warm PDO cool PDO
Baseline shrimp crab ceph. elasmo. rockfish roundfish flatfish hake salmon forage 5,000 4,000 3,000 2,000 1,000 change from baseline - $ (000s) 0 -1,000 -2,000 -3,000 -4,000 -5,000 crab hake birds phyto ceph. flatfish forage shrimp infauna salmon rockfish elasmo. epifauna roundfish meso-zoo macro-zoo marine mamm. bumped group (+1%)
shrimp crab ceph. elasmo. rockfish roundfish flatfish hake salmon forage 5,000 4,000 3,000 2,000 1,000 change from baseline - $ (000s) 0 -1,000 -2,000 -3,000 -4,000 -5,000 crab hake phyto birds ceph. flatfish forage shrimp infauna salmon rockfish elasmo. epifauna roundfish meso-zoo macro-zoo marine mamm. bumped group (+1%) Cool PDO
shrimp crab ceph. elasmo. rockfish roundfish flatfish hake salmon forage 5,000 4,000 3,000 2,000 1,000 change from baseline - $ (000s) 0 -1,000 -2,000 -3,000 -4,000 -5,000 crab hake phyto birds ceph. flatfish forage shrimp infauna salmon rockfish elasmo. epifauna roundfish meso-zoo macro-zoo marine mamm. bumped group (+1%) Warm PDO
Yield during 1st 5 years as fraction of MSY 24 Rockfish 12 Tuna Hake 0 2 Fishing Mortality Equilibrium yield as percent of unexploited biomass 20 Tuna 15 Hake 10 5 Rockfish 0 2 Fishing Mortality
NCC ETP
NCC ETP
NCC ETP
NCCE X ETP
How about a salmon fishery? • Can the issue be framed in a similar light? • Does climate make a difference? • What are the structural variables (ecosystem services)? • How do we define the value of ecosystem services?