Download
1 / 29
300 likes | 721 Vues
Production and Cost Chapter 5. Productivity => Cost => Profitability. Today’s agenda. Collect Assignment 1 Status of first half of applied managerial economics How much to produce? Marginal analysis applied to choice of price and quantity

E N D
Production and CostChapter 5 Productivity => Cost => Profitability
Today’s agenda • Collect Assignment 1 • Status of first half of applied managerial economics • How much to produce? • Marginal analysis applied to choice of price and quantity • How to produce? – Output maximization and cost minimization • What to produce? – Competitive Strategy Ch. 8 • For whom to produce – Consumer behavior and Ch. 7 pricing • Production & Cost concepts • “short run” • Returns to an input & cost functions • Profit maximization • Marginal product and marginal revenue product • “long run” • Optimal input mix – output maximization and cost minimization • Economies of scale
General Ideas • Production functions • show how output varies as input usage varies • Cost functions • show different cost measures & how they vary as output varies • What can you do to improve productivity? Lower costs? • Link to profits
Short run production & cost • Short run some inputs held fixed while other(s) vary • Production Returns to an input x is sensitivity of output to the input x Total product TP = output (Q) produced per period Average Product AP = output per unit of input x = TP / x Marginal Product MP = change in output per unit increase in input x = D TP / Dx • Cost • Fixed cost and variable cost per period shown as functions of output • TFC + TVC = TC which varies with output (Q) • Per unit costs – each total cost measure per unit of output • e.g. AVC = TVC/Q • AVC + AFC = ATC • Marginal cost = change in TC per unit increase in output = D TC/ D Q
Production functionsIsoquants • An isoquant map is a method to display production functions in graphical form • Short and long run applications • Definition: An isoquant shows the set of all input combinations that produce the same level of output.
The Soprano Garbage CompanyShort Run Costs using isoquant data • The Soprano Garbage Company hires labor and capital to produce dumpsters. The price of labor is $3. The rental rate of capital is $2 per unit. In the short run, the Sopranos have 5 units of capital. • Given the isoquant map shown, calculate & draw this firm’s short-run total cost curve, short-run average cost curve, short-run average variable cost curve, short-run average fixed cost curve, and marginal cost curve.
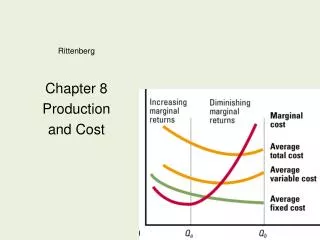
Short run production & cost – classic case • Diminishing returns to the variable input • Concave TP curve • Diminishing MP curve • Increasing MC curve (if single variable input) • Marginals influence averages • If MP falls below AP, it pulls AP down • Bad game pulls batting average down • If MC rises above AVC, it pulls AVC up
Short run production & cost: discussion • What causes diminishing returns to a variable input? • Pick a good/service your org. produces. Could you double production next month? If so would your marginal costs increase? • How do the Soprano's cost functions compare with classic case? What can you infer about differences in productivity patterns?
Profit maximization / Loss-Minimization in the short run • Total profit = TR - TC • To maximize total profit or minimize total loss • A firm should increase output as long as marginal revenue exceeds marginal cost • A firm should not increase output if marginal cost would exceed marginal revenue • At the profit-maximizing level of output, (approx) MR=MC • Fixed costs are irrelevant for determining this level of output
Loss-Minimization:Short run shut-down case • “Shutting down production” • producing zero output while continuing to pay fixed cost • Minimize loss by shutting down if TR < TVC e.g. $50 < $60 with TFC = $10 if operate then loss is $20 if shut down then loss is $10 – why? Equivalently, shut down if P < AVC. Where is Sopranos shut down point? • What is the Sopranos’ output if competitive market price is $1? $3? Resulting profit?
“Long-run” production and cost In future a manager could • Change levels of fixed inputs • Substitute capital for labor • Increase the entire scale of operations We will look at three ways to possibly reduce costs • Substituting one input for another (optimal input mix) • Increasing scale (extra capital & other inputs) • Increasing scope (additional related products) • Increasing learning (feedback from more output)
Long run: Optimal input mix Many inputs have some degree of substitutability • Degree of automation – people vs. machines • Different metals in automobile parts • Different types of labor – e.g. skilled vs. unskilled • Great hitting versus taking walks • Blazing fastball versus deceptive ball movements Cost Minimization Problem • Choice variables – levels of inputs • Objective – minimize total cost of producing a target output level Dual Problem: Output maximization for a given level of cost • Objective –maximize output for a given target level of expenditures
Optimal input mix Isoquants • Each isoquant shows different combinations of inputs (metals) that will produce a given amount of output (auto parts) • Isoquants portray technical combination of inputs to produce a given level of output • Slope = marginal rate of technical substitution of one input for the other = ratio of marginal products of the two inputs
Optimal input mix exampleIsoquants: differing input substitutability • Curvature of isoquants reflects degree of substitutability of inputs • In our example, steel & aluminum have substitute AND complement characteristics • Perfect substitutes would have straight-line isoquants
Cost Minimization Problem Many inputs have some degree of substitutability • Degree of automation – man vs. machine • Different metals in automobile parts • Different types of labor – e.g. skilled vs. unskilled • Great hitting versus taking walks • Blazing fastball versus deceptive ball movements Cost Minimization Problem • Choice variables – levels of inputs • Objective – minimize total cost of producing a target output level • Mr. Burn’s Principle Dual Problem: Output maximization for a given level of cost • Objective –maximize output for a given target level of expenditures
Cost Minimization ProblemIsocost lines • Isocost lines portray combinations of inputs that entail the same cost • Isocost lines change as input prices change • TC = PXX + PYY Slope of isocost is
The optimal choice of inputs is whereSlope of the isoquant = Slope of isocost line"optimal input mix" rule Input Y per week TC1 TC2 Excellent! MRTS=Relative Price of Inputs TC3 Y* q1 0 Input X per week X*
Optimal Input MixChange in input prices If price of steel rises then Ps/Pa goes up and isocosts get steeper => Change cost minimizing input mix to more aluminum, less steel
Discussion: The Oakland A’s and Cost minimization • How did the A’s produce more at a lower cost??? • Specifically how did the management change the A’s mix of inputs? • What will Beane do if the relative prices of different types of baseball talent changes? • Additional questions?
Optimal Input MixDerivation of Long run cost curvesThe Sopranos • The Soprano Garbage Company hires labor and capital to produce dumpsters. The price of labor is $3. The rental rate of capital is $2 per unit. In the long-run, the Sopranos can vary both the amount of labor and capital they use. • The expansion path shows the tangencies between various isocost lines and isoquants. • Calculate & draw this firm’s long-run total cost curve, long-run average cost curve, and marginal cost curve. • How do these costs compare with the short-run counterparts? Why?
Optimal Input MixDerivation of long run cost curvesThe Sopranos
Cost Minimization Problem Example: Labor substitutability • Choose high school or college educated reps? • Compare relative productivities with relative wage rates • Minimize labor cost by choosing most favorable cost/productivity ratio • Other considerations?
College grads HS grads Average Sales per worker $1.88333 mill/year $1.475 mill/year Hourly wage $10.25 / hour $6.82 / hour Wage and sales higher Wage and sales lower Cost Minimization Problem - Example Choose between skilled and unskilled sales workers to minimize total wage cost of achieving a target level of sales revenue
Economies of Scale • Scaling up levels of all inputs due to higher production scale can alter ATC patterns. The fixed costs are higher but savings in AVC may offset. • Economies of scale for plant sizes 1,2,3 on graph but diseconomies of scale thereafter • Many companies have constant returns to scale, which means that lowest ATC doesn’t vary with expansion. The dark, lower envelope of the SR average cost curves is the “long run average cost” curve: lowest achievable unit costs for different scales when you can vary all inputs.
Looking Forward • Assignment 2 – on Blackboard • Due on October 14,18, or 19 • Read Managerial Economics Chapters 6 and 8 • Wal-Mart, p. 221 • Going for the Gold and Pineapple Acid Test, WSJ • What are/were the barriers to entry into the premium pineapple market? What is/will be the market structure of that market? Profitability? • Note on the Structural Analysis of Industries – Michael Porter • Pick a market/industry with which you are familiar. Based on your text reading, how would you describe its market structure and why? How narrowly/broadly are you defining the market (e.g. does Coke compete in all beverages or bottled soft drinks)? How would you characterize barriers to entry to this market?