Download

1 / 20
200 likes | 368 Vues
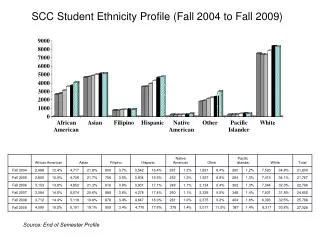
Fall 2004 Student Demographics. From Assistant Dean Mary Southard’s office. Fall 2004 Enrollment. Headcount 3,881 Full-time Equivalent 2,678 Mean Semester Hours 10.35. Headcount and FTE Fall 2004. Mean Unit Load* Fall 2000-Fall 2004. Regional Campus Enrollment Fall 2004.

E N D
Fall 2004Student Demographics From Assistant Dean Mary Southard’s office
Fall 2004 Enrollment • Headcount 3,881 • Full-time Equivalent 2,678 • Mean Semester Hours 10.35
Mean Unit Load* Fall 2000-Fall 2004 * average hours per student
Regional Campus EnrollmentFall 2004 • Regional Campuses Headcount 12,376 • Stark Campus Headcount 3,881 (31%) • Regional Campuses FTE 8,075 • Stark Campus FTE 2,678 (33%)
Regional Campus EnrollmentFall 2004 • Kent Campus Undergraduate Headcount 19,173 • Stark Campus Undergraduate Headcount 3,881 • Kent Campus Undergraduate FTE 16,944 • Stark Campus Undergraduate FTE 2,678
Enrollment by GenderFall 2004 • 62% Women • 38% Men
Enrollment by CountyFall 2000- 2004 Percent of Total Enrollment
Enrollment by Class LevelFall 2004 • Freshmen 1,650 42.5% • PSEO 188 4.8% • Sophomores 725 18.7% • Juniors 565 14.5% • Seniors 592 15.2% • Post-bacc 104 2.7% • Grad students 22 0.6% • Non-degree 35 0.9%
Enrollment by CollegeFall 2004 • Arts and Sciences 801 20.6% • Architecture& Environ Design 28 0.7% • Business Administration 602 15.5% • Communication & Information 159 4.1% • Education 349 10.3% • Fine & Professional Arts 323 8.3% • Nursing 366 9.4% • Stark (AA/AS and PSEO) 455 11.7% • Undergraduate Studies 752 19.3% • Technology 461.1%
Popular MajorsFall 2004 Business * 602 Education* 349 Justice Studies 205 Nursing* 366 Psychology 188 English 75 Biology/Pre-med * 96 Journalism* 119 History 64 *Includes pre-professional programs
New AdmissionsFall 2000- Fall 2004 Year Fall Spring Total 00-01 1354 457 1811 01-02 1390 483 1873 02-03 1449 536 1985 03-04 1510 512 2022 04-05 1589 472 2061
New FreshmenJune 2004 High School Graduates Fall 2004 • Admitted 764 • Enrolled 593 • Yield Rate 78%
New FreshmenFall 2004June 2004 High School Graduates • Mean High School GPA 2.91 • Mean ACT Composite 20.01 • 3.00 High School GPA 46% • 3.50 High School GPA 19% • 1.99 High School GPA 7%