Download
1 / 38
380 likes | 525 Vues
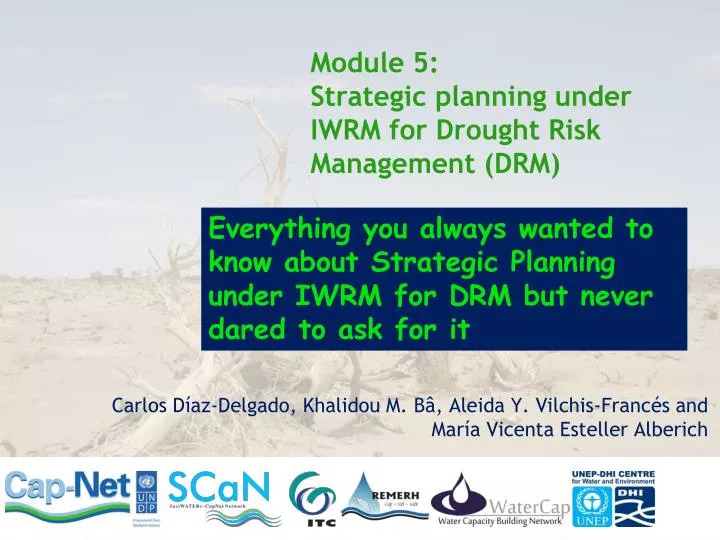
Module 5: Strategic planning under IWRM for Drought Risk Management (DRM). Everything you always wanted to know about Strategic Planning under IWRM for DRM but never dared to ask for it. Carlos Díaz-Delgado, Khalidou M. Bâ, Aleida Y. Vilchis-Francés and María Vicenta Esteller Alberich. Outline .

E N D
Module 5:Strategic planning under IWRM for Drought Risk Management (DRM) Everything you always wanted to know about Strategic Planning under IWRM for DRM but never dared to ask for it Carlos Díaz-Delgado, Khalidou M. Bâ, Aleida Y. Vilchis-Francés and María Vicenta Esteller Alberich
Outline • Goal • Learning objectives • Introduction to DRM • Strategic Planning under IWRM for DRM • Set of Critical Success Factors Matrix for Drought • Performance Indicators • Scorecard for a Performance indicator • PSIR framework for Drought Performance Indicators System • How to prioritize Performance Indicators and identify their specific weight for DRM? • Strategies for DRM • How to prioritize Strategies to increase Drought Resilience in the socio-ecosystem ? • Lessons Learnt
Goal of the module Goal To outline the methodology to build a tactical strategic planning taking into account a participatory process, with a sustainable development approach and IWRM principles for DRM.
Learning objectives of the module Learning Objectives At the end of this module participants are expected to: • Understand that management must start before droughts occurs • Be aware of some of the various management options available • Understand how to screen options and select the best set of them through the use of indicators • Know how to build a strategic plan for DRM
Introduction • Drought as an extra-ordinary water deficit has three stages: before, during and post event occurrence, thus each of them needs a tailor-made DRM Plan. • The lack of integration of the several approaches to DRM, such a sustainable land management, water resources management, food security and so on, is highlighted as a weakness, particularly at a national level, which is separated along sectoral lines.
Introduction Drought Risk Management (DRM) DRM can be defined as “the systematic process of using administrative directives, organizations and operational skills and capacities to implement strategies, policies and measures for improved coping capacities in order to lessen, i.e. prevent mitigate and prepare for, the adverse impacts of drought and the possibility of disaster” (UNISDR, 2009)
Introduction River basin must be seen as a Socio-ecosystem with several dimensions. It is generally the most integrated scale and where greater tractions for DRM occurs at lower levels and efforts are optimized. Nature Sectoral line Administration IWRM Society + Governments + Education & ResearchInstitutions
Strategic planning under IWRM for DRM START Process(1) River basin Planning stakeholders work team building Basic information and stakeholders identification Process(2) To define PCSA s Process(3) Process(6) StrategicParticipatoryPlanningprocess (SLOT) To Define and PrinttheScorecards Process(5) Process(4) End of the first planning cycle To define and selectthestrategiesforeach PCSA To define PCSA’ Performance Indicators
Planning stakeholder’s work team building • It is the work team by which the decision make process and the proposal defining the plan of the basin will take place. • It must be composed of an interdisciplinary combination of the different areas involved.
Social PCSA Strategic planning under IWRM for DRM PCSA: Planning and Coordination Strategic Area Environment PCSA- Economic PCSA- Environment Economic Education & Research Institutions Governments - PCSA- Information Science & Technology PCSA- Social Social Organizations
Set of Critical Success Factors (CSFs) Matrix for Drought SLOT analysis is the process in which each of the PCSA’s is analyzed through: • A fair, equal and oriented analysis towards the prioritization of the Critical Success Factors in the basin (SLOT). • A Strategic Participatory Planning Process
Set of Critical Success Factors (CSFs) Matrix for Drought Critical Success Factors for Drought Risk Management under the SLOT Analysis Helpful Strengths Limitations Strengths are the qualities that enable us to accomplish the organization’s missions and goals for drought risk management. These are the basis on which resilience against drought has been a continuous success and could be continued or sustained. Limitations are the qualities that prevent us from accomplishing the organization’s mission and achieving the resilience of the socio-ecosystem against drought. Internal Threats Opportunities Opportunities arise when the organization can take benefit of conditions in order to increase resilience and control against drought. They could arise from acquisition of knowledge, advances in science and technology, monitoring key parameters, and in consequence enhance strengths and minimize limitations and threats. Threats arise when external conditions, without possible organizational control, make vulnerable the socio-ecosystem against drought phenomena. External Harmful
Set of Critical Success Factors (CSFs) Matrix for Drought SLOT analysis for the PCSA- Environment Helpful Strengths Limitations • Natural drainage network • High precipitation index • Geomorfological altitude variability • Hydraulic agricultural infrastructure • Soil permeability • High erosion index • Drought seasons • Overexploitation of water • Bad water quality Internal Threats Opportunities • Climate and geography suitable for water supply • Private and public investment for new water treatment facilities • Shallow ground waters • Ground water pollution • Great and constant pollution of surface water bodies • Availability and water quality • Overexploitation of ground water External Harmful
Set of Critical Success Factors (CSFs) Matrix for Drought Plot of decision matrix of CSF from SLOT analysis
Set of Critical Success Factors (CSFs) Matrix for Drought Evaluate CSFs on X and Y axis. If CSF on X is more important CSF on Y print “1”, otherwise print “0” “X” Axis “Y” Axis
1. Do a horizontal sum for the 1’s2. Do a vertical sum of number of 0’s3. Take the horizontal sum and place it vertically4. Sum step 2 and 3 “X” Axis “Y” Axis
Set of Critical Success Factors (CSFs) Matrix for Drought Finally we have the Critical Success Factors with higher scoring in hierarchical order, from which we will generate a conceptual map and build performance indicators to model them.
Overexploitation of aquifers Availability and quality of water Affects Set of Critical Success Factors (CSFs) Matrix for Drought Conceptual map Capture and Storage Favor to By Contributes to High precipitation index Has Geomorfological altitude variability PCSA - Environment Depends on Depends on Generate Influences in Generate Has Natural drainage network Needed With Depends on Uses Exceptional chemical characteristics Living beings or creatures Industrial Domestic Agricultural Favorable for the development of Plants Animals Human beings Lower density in a solid and liquid state Causing damage to Generate Universal solvent Temperature regulation Great and constant pollution of superficial water bodies
Overexploitation of aquifers Availability and quality of water Affects Set of Critical Success Factors (CSFs) Matrix for Drought Conceptual map Capture and Storage Favor to By Contributes to High precipitation index Has Geomorfological altitude variability PCSA - Environment Depends on Depends on Generate Influences in Generate Has Natural drainage network Needed With Depends on Uses Exceptional chemical characteristics Living beings or creatures Industrial Domestic Agricultural Favorable for the development of Plants Animals Human beings Lower density in a solid and liquid state Causing damage to Generate Universal solvent Temperature regulation Great and constant pollution of superficial water bodies
Performance Indicators • Performance Indicators serves to construct an integrated characterization of the basin, and from which one can make adequate decisions to protect the environment and promote, in this case, a better drought resilience. • Such indicators are going to be Pressure, State, Impact and Response (PSIR)
Performance Indicators The focus of a IWRM for DRM must go farther than the argument of environmental topics, description of the biophysical environment, or the representation of social or environmental data. In other words, it must: Consider the analysis of conditions and trends of the environment and their causes (State of the environment and Pressure). Evaluate and interpret the implications and impacts of this tendencies in health, economy and ecosystems (Impact). Provide an evaluation of the actual social response and potential environmental problems in the context of the state’s environment (Response).
Performance indicators • PSIR model facilitates to identify: • Which indicators have more cause-effects relationships, • Indicators with greater specific weight on the Socio-ecosystem • Indicators on critical state, • Indicators more, or less, vulnerable, P R S I • Key indicators, • Lack of information, • Non-necessary indicators, • Missed indicators, • Trends of Socio-ecosystem over time and space.
Performance Indicators Generate a matrix where the indicators are going to be placed vertically and horizontally with the objective to form a cross validation matrix similar to the SLOT process
Performance Indicators • The comparing cross matrixes process is going to be used with all the PCSA’s. • This means that we have to place a PCSA on the X parameter first and then we’re going to compare it with all the indicators of the rest PCSA’s and so on until we finish all the comparisons. • Afterwards we will obtain the number of links that each indicator has with respect to the comparisons obtained with the rest of the indicators.
Performance Indicators Matrix summary of the number of links between indicators for the PCSA’s
Performance Indicators With the result of the links obtained, we can proceed to select the criteria that has the highest value in the sum, and then establish a hierarchy of each indicator, i.e. the indicator with the highest number of links will have the highest rank. Greatest Number of Links, then Highest Rank. Least Number of Links, then Lowest Rank.
Performance Indicators Once the hierarchy is obtained from the data, the total number of indicators are going to be taken and through equal intervals specific weights are going to be established.
Strategies for DRM • Strategy for DRM is the direction and scope which seeks to achieve advantage of the Socio-ecosystem increasing its resilience against drought through within a challenging reality, to the needs of a sustainable development and to fulfill the stakeholder’s expectations. • At the end of this stage we will have a set of strategies, at least one, for each PCSA taking into account their set of Performance Indicators and their correspondent cause-effects analysis in order to define each specific strategy. • In order to prioritize the strategies we have to analyse which, and how many, Performance Indicators are considered for each strategy. • Based on the number of Performance Indicators and their specific weight, we can obtain the specific weight of each strategy simply adding the specific weight of Performance Indicators involved on each one of them.
Example of proposed strategies Strategies for DRM
A Matrix will be created where in the vertical axis we will place the strategies and in the horizontal axis the indicators with the purpose of comparing by the method of cross validation where 1 will be placed if the strategy fulfills the indicator and 0 if it won’t. Strategies for DRM
Strategies for DRM Based on the indicators that the strategy will fulfill we will extract the specific weight of each one, and then sum the specific weights of the indicators in order to obtain the total weight of the strategy.
Once the weight of each strategy is obtained a hierarchization process of the strategies will take place placing them from higher to lower according to their weight. Strategies for DRM
Scorecard for Performance Indicators Strategies for DRM • The scorecard is a technical fact sheet which contains, in a structured way, the conceptual elements and essential methodologies used to build the specific Performance Indicator. • It also presents the technical support of the information needed to construct it and how to interpret the results obtained after its calculation. • The Scorecard allows us in an easy way to communicate the modelled aspect of the system by this Performance Indicator to the decision maker or general audience.
Scorecard for Performance Indicators Strategies for DRM
Lessons learnt • There are several management options to prepare for drought and to manage water during drought, but we can optimize the plan in order to give the best answer for the system. • The indicators system makes possible the process of monitoring key variables needed to make decision and improve the resilience against drought. • Emphasis should be on drought mitigation, preparedness a non-structural measures. • Early warning and drought management planning can reduce the socioeconomic impacts and improve resilience of the Socio-ecosystem.
Lessons learnt Even though the process presented is relatively simple, a software has been developed in order to make easy to build a Strategic Plan for DRM under IWRM principles. Then, lets go for planning against Drought and ... Turn Words into Action!!!