Download
1 / 37
370 likes | 377 Vues
太陽雑誌会 2005.02.07 T.T.Ishii. The Astrophysical Journal, 619:1160–1166, 2005 DISTRIBUTION OF THE MAGNETIC FLUX IN ELEMENTS OF THE MAGNETIC FIELD IN ACTIVE REGIONS V. I. Abramenko 1,2 and D. W. Longcope 3 Received 2004 August 17; accepted 2004 October 12

E N D
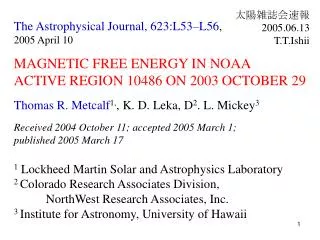
太陽雑誌会 2005.02.07 T.T.Ishii The Astrophysical Journal, 619:1160–1166, 2005 DISTRIBUTION OF THE MAGNETIC FLUX IN ELEMENTS OF THE MAGNETIC FIELD IN ACTIVE REGIONS V. I. Abramenko1,2 and D. W. Longcope3 Received 2004 August 17; accepted 2004 October 12 1 Big Bear Solar Observatory, New Jersey Institute of Technology 2 Crimean Astrophysical Observatory, Nauchny, Crimea, Ukraine 3 Department of Physics, Montana State University
Abstract The unsigned magnetic flux content in the flux concentrations of two active regions is calculated by using a set of 248 high-resolution SOHO/MDI magnetograms for each active region. Data for flaring active regionNOAA 9077 (2000 July 14) and nonflaring active region NOAA 0061 (2002 August 9) were analyzed. We present an algorithm to automatically select and quantify magnetic flux concentrations above a threshold p. Each active region is analyzed using four different values of the threshold p ( p = 25, 50, 75, and 100 G).
Abstract (cont.) Probability distribution functions and cumulative distribution functions of the magnetic flux were calculated and approximated by the lognormal, exponential, and power-law functions in the range of flux > 1019 Mx. The Kolmogorov-Smirnov test, applied to each of the approximations, showed that the observed distributions are consistent with the lognormal approximation only. Neither exponential nor power-law functions can satisfactorily approximate the observed distributions. lognormal distribution: 対数正規分布 ln(X)が正規分布に従う分布 log-log表示だと放物線
Abstract (cont.) The parameters of the lognormal distribution do not depend on the threshold value; however, they are different for the two active regions. For flaring active region 9077, the expectation value of the magnetic flux content is m = 28.1×10¹⁸ Mx, and the standard deviation of the lognormal distribution is s = 79.0×10¹⁸ Mx. For nonflaring active region NOAA 0061, these values are m = 23.8×10¹⁸ Mx and s = 29.6×10¹⁸ Mx. The lognormal character of the observed distribution functions suggests that the process of fragmentation dominates over the process of concentration in the formation of the magnetic structure in an active region.
Introduction Magnetic fields in the solar atmosphere are thought to be concentrated in thin flux tubes anchored in the photosphere, where their footpoints form concentrated clusters of magnetic flux. Information on the dynamics and statistical characteristics of the photospheric magnetic field is necessary when analyzing processes in the corona because of the magnetic coupling between the photosphere and the corona. Modern observational techniques allow us to calculate the distribution function of flux concentrations of the magnetic field only at the photospheric level.
Introduction(cont.) Wang et al. (1995) studied the dynamics and statistics of the network and intranetwork magnetic fields using BBSO videomagnetograph data. The authors argued that the distribution function follows a power law. They found a power index of -1.68 for areas in which the flux was in the range (0.2 -1)×1018 Mx (intranetwork fields) and -1.27 for areas in which the flux was in the range (2 -10)×1018 Mx (network elements).
Introduction(cont.) Schrijver et al. (1997) used high-resolution data of a quiet network area from the SOHO/MDI. They reported that the flux distribution function follows an exponential law with a slope of approximately 1×10¹⁸ Mx-1 in areas in which the flux ranges from 1 to 5 ×10¹⁸ Mx.
Introduction(cont.) In this study, we calculate and analyze the distribution of magnetic flux concentrations in the two well-developed active regions in the range of flux >1019 Mx. We pay special attention to the analytical approximation of the observed distribution. Observational Data SOHO / MDI, high resolution magnetograms NOAA 9077 (2000 July 14) : X5.7 NOAA 0061 (2002 Aug. 9) : several C-class flares
NOAA 9077 2000 July 14, 06:26 UT 145 ’’
NOAA 0061 2002 Aug. 9, 11:00 UT 116 ’’ 220 ’’
Selection of magnetic flux concentrations 0. set the threshold 1. determine local peak 2. outline the flux concentrations 3. calculate their flux content
Check the completeness <Bz> OK
Cumulative Distribution Function Power law 1-CDF Kolmogorov-Smirnov test : ×
Cumulative Distribution Function exponential 1-CDF Kolmogorov-Smirnov test : ×
Cumulative Distribution Function lognormal 1-CDF Kolmogorov-Smirnov test : ○
Conclusions and Discussion We have presented the results of fitting the probability distribution function, PDF (F) of the magnetic flux concentrations of two active regions. Lognormal distributions are consistent with each data set; however, the two active regions are fitted by distributions with different parameters. The lognormal distribution of the flux content in magnetic flux elements of an active region suggests that the process of fragmentation dominates the process of flux concentration.
Conclusions and Discussion(cont.) Assuming that the lognormality of the concentration flux results from repeated, random fragmentation, we may attribute meaning to the distribution parameter. The variance of ln F, s2, is proportional to the number of independent fragmentations that produced a given concentration from a single initial concentration. If the basic fragmentation process is similar in all active regions, then the value of s2 is proportional to the time over which fragmentation has occurred.
Conclusions and Discussion(cont.) Since the value of s2 for AR 9077 is larger than that of AR 0061 by a factor of 2.3, AR 9077 may be older than AR 0061 by approximately that factor. Alternatively, AR 9077 may have undergone more vigorous fragmentation over a comparable lifetime. This explanation may also account for their very different levels of flaring activity. Note that a very intense fragmentation of sunspots during several days before the Bastille Day flare in AR 9077 was reported by Liu & Zhang (2001).
Liu and Zhang 2001 論文の内容はここまで 以下つっこみ
分布関数のどっちがより観測を説明するかの 議論にKS test を使うのは良くない lognormal以外合わないっていう言い方なので 比較してるわけではないのかもしれないが 適合度検定(test)は、仮定したモデルが 合っているかどうかを評価するもので モデルの優劣を評価するものではない モデルの優劣は、分布間の距離の指標 例えばAIC (Akaike’s information criterion)などで 評価する
論文のパラメータでグラフかいたら normalizationがあわなかった (PDFを積分して 1になってるか心配) 黄色が観測結果 赤がlognormal、青がexponential、緑がpower law
そこで適当にずらして表示 黄色が観測結果 Fitting は > 1019 Mx 赤がlognormal、青がexponential、緑がpower law
Fittingした範囲のみ表示 黄色が観測結果 赤がlognormal、青がexponential、緑がpower law
Power law のベキを変えてみる 黄色が観測結果 緑が論文の(-1.45)、青が -2.5、 赤はdouble power law (-1.45と-2.5)
Exponential では大きい側が再現できない 青が論文の(beta 0.05)、緑が 0.1、赤が 0.01
Lognormal のパラメータを変えてみる m(平均)をいじると横方向にシフト 赤が論文の(m 2.2)、青が 1.0、緑が 3.0
Lognormal のパラメータを変えてみる s(分散)をいじると幅が変わる 赤が論文の(s 1.49)、青が 1.0、緑が 2.0
Lognormal は小さい側で減る Completeでない観測結果より本来は数は多いはず 赤がlognormal、青がexponential、緑がpower law
小さい側で減らないで大きい方も合いそうな関数形小さい側で減らないで大きい方も合いそうな関数形 Saunders’ Luminosity Function (LF) for IRAS galaxies どうしてこういう形になるかの物理的解釈はまだない