Download
1 / 17
170 likes | 183 Vues
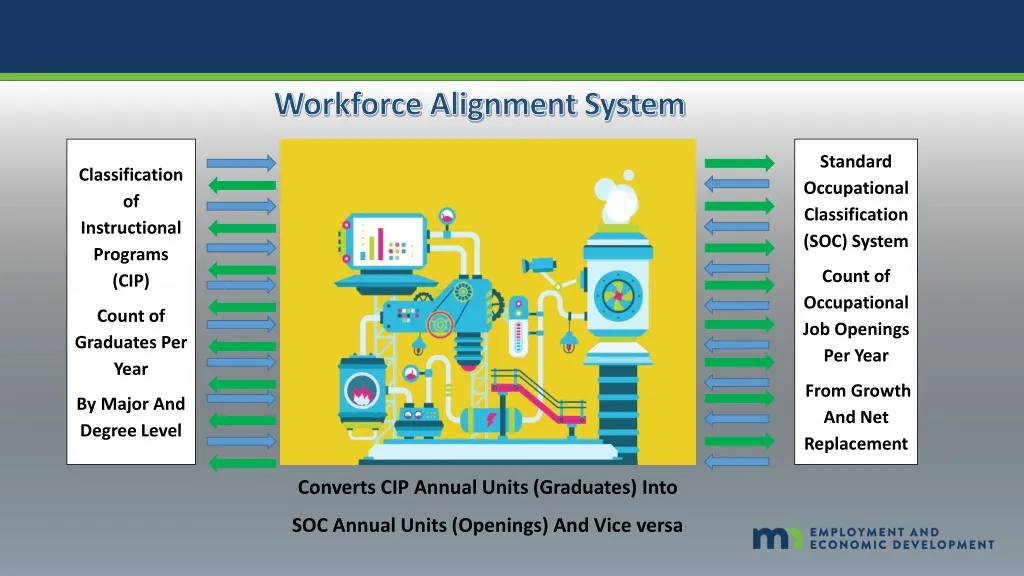
Workforce Alignment System. Classification of Instructional Programs (CIP ) Count of Graduates Per Year By Major And Degree Level. Standard Occupational Classification ( SOC) System Count of Occupational Job Openings Per Year From Growth And Net Replacement.

E N D
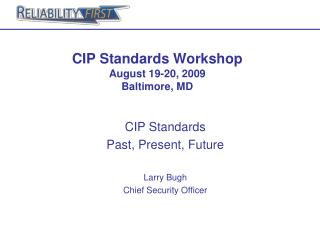
Workforce Alignment System Classification of Instructional Programs (CIP) Count of Graduates Per Year By Major And Degree Level Standard Occupational Classification (SOC) System Count of Occupational Job Openings Per Year From Growth And Net Replacement Converts CIP Annual Units (Graduates) Into SOC Annual Units (Openings) And Vice versa
What are we trying to do? • An important question – are we producing graduates from the right fields of study and in the right numbers relative to the employment opportunities available to new graduates? • Separations estimates are not designed to answer this question – “BLS projections of occupational openings are not direct estimates of training needs for an occupation, as not all of the workers who will fill openings require training”, specifically those transferring in from another occupation. • The notion of Career Ladders emphasizes the benefits of occupational transfers of incumbent workers – we should account for this • This is not meant to replace BLS Replacements – this attempts to answer a different question than BLS answers
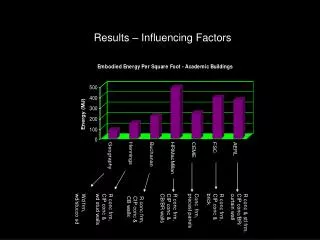
Workforce Alignment versus BLS Separations Occupation X2 Unemployed or Out of the Labor Force WA Net Replacements = Outflow from Occupation – Inflow into Occupation Occupation Z1 (Different MOG) Occupation X1 BLS Projections Separations estimate flows in RED, we want to estimate all flows Occupation Y Unemployed or Out of the Labor Force, Including Those in School Occupation Z2 (Same MOG)
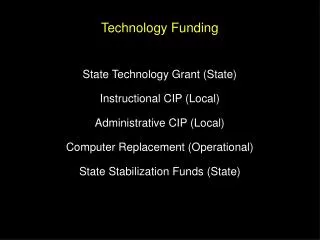
Real Example Using Database Administrators BLS Separations Method Yields 53 Exits and 104 Transfers = 157 Openings + 46 Growth Openings =203 Total Openings Are these Opportunities for New Grads? We find 49 exits and 463 Transfers (and the same 46 in Growth) but 445 Transfers In taking all but 113 openings These are the openings available to new grads AFTER incumbent workers fill most jobs Occupation X2 Unemployed or Out of the Labor Force 49 Occupation Z1 (Different MOG) Occupation X1 445 101 “Stayers” = 2,090 DBAs – 15-1411 Growth = 46 362 113 Unemployed or Out of the Labor Force, Including Those in School Occupation Z2 (Same MOG)
Process for Generating Occupational Transition Matrix • Used 2013-2017 March CPS ASEC IPUMS, particularly information on current and last year’s occupation/employment status. • Calculated percent of employment in Occ X in year ending up in each of the other occupations and labor force statuses in year • Example: • 90% of nurses will be nurses next year • 5% will exit labor force • 4% will be employed in other health practitioner occs (this is broken out) • 1% will be employed in other unrelated (other MOG) occupations (this is broken out) • Due to sample size, we use and apply national level transition rates • Also dropped any transition rate < 0.5%, combined a handful of very small occupations into a “misc small occs” category
This is what that looks like – We can provide Side Project – use this matrix to identify significant and persistent “career ladder” transitions
Notice Block Diagonal nature of this matrix Most transitions (77% in MN) are within MOGs or even 3-digit blocks As we would expect in the case of most “career ladder” transitions
Next steps require state-specific inputs • Estimates of occupational employment and corresponding estimates of unemployed, NILF, and self employed for year t and year t+1 • We do one-year-ahead projections every quarter, you could just cut your two-year projections in half • Do also need working age pop and labor force projections one year ahead • Enter these in left-hand column (year t) and top row (year t+1) • Multiply year t values by rates to get transition levels (number of workers moving from Occ X in t to Occ Y in t+1) • Iteratively rake the matrix levels until they are consistent with both year t and year t+1 occupational estimates • This produces the occupational transition matrix in levels that is consistent with your state’s occupational mix and one-year projections
Example – the portion of the matrix covering Computer & Math This allows us to calculate the exits, entries and transitions needed to determine net replacements available to new grads as in example above
Now that we have demand, how about supply? • Need a count per year of graduates by CIP and Award level – essentially measuring the postsecondary capacity to produce these grads annually • We use SLDS and WDQI, but EDEPS IPED data could be used
Another challenging step – converting demand units into supply units • Unfortunately, we must rely on a CIP-to-SOC crosswalk • We have been experimenting with 3 versions • One that is pretty close to the standard NCES version • One that limits transitions from CIP to SOC that are most direct trainings • One that expands transitions to include “sensible and empirically frequent” (ACS) employment outcomes (Work still in progress) • For example, for Web Developers (15-1134),the most direct program would be CIP 110801 - Web Page, Digital/Multimedia and Information Resource Design, but other IT fields such as CIP 110103 – Information Technology is part of the standard crosswalk, and 10% of Web Developers studied CIP 520201 - Business Management and Administration, which is “sensible and frequent” • I’ll limit examples to the “close to standard” version
Handling educational requirements • In distributing the supply of grads across the occupations they qualify for, we also apply this by award level • Given past “debate” over the appropriate degree necessary for many occupations, we used nearly a half million response to our job vacancy survey to determine ed requirements by MN employers for the various occupations they were trying to fill • Found that the standard BLS classification was not too far off • We use our own classification, but you can use BLS and not be too far off • We then distribute grads across occupations, and distribute occupational openings across grads, to derive surplus/shortage estimates for both CIPs and SOCs
Summary • Replacement openings as estimated through projections do not tell us how many students should pursue a major to enter an occupation • For that we need to account for occupational transitions (career ladders) of incumbent workers • This represents our effort to address this VERY challenging need • Major challenges are lack of precise and reliable data, especially regarding occupational transitions and CIP-SOC transitions • Another reason to collect occupational codes/titles on wage records • And to put some serious thinking into the CIP-SOC crosswalk • Comments and collaborations are welcome!!!!!!! Call me !!!!!!!! Thank You!!!!!!!!