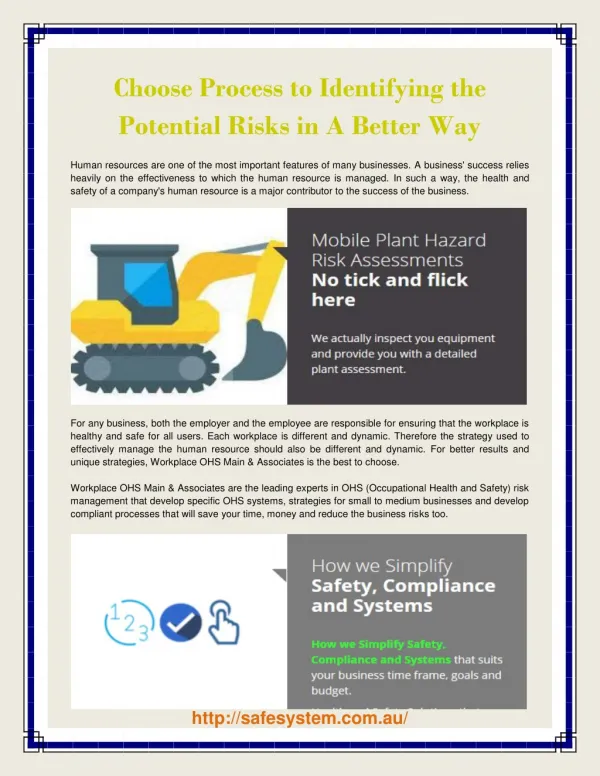
Download
1 / 35
350 likes | 509 Vues
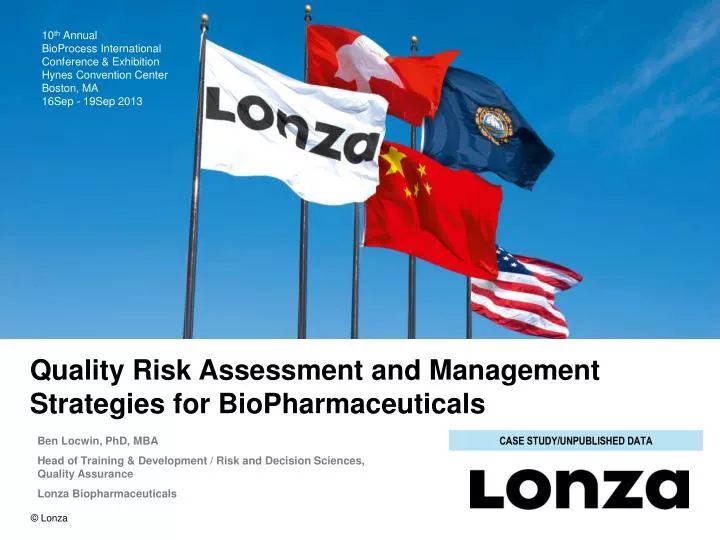
Quality Risk Assessment and Management Strategies for BioPharmaceuticals. 10 th Annual BioProcess International Conference & Exhibition Hynes Convention Center Boston, MA 16Sep - 19Sep 2013. Ben Locwin, PhD, MBA

E N D
Quality Risk Assessment and Management Strategies for BioPharmaceuticals 10th Annual BioProcess International Conference & Exhibition Hynes Convention Center Boston, MA 16Sep - 19Sep 2013 Ben Locwin, PhD, MBA Head of Training & Development / Risk and Decision Sciences, Quality Assurance Lonza Biopharmaceuticals CASE STUDY/UNPUBLISHED DATA
Risk Analysis – A Brief Primer • Where does risk assessment come from? • Why is it important? • What is the overall utility?
Why Do We Need Formal Tools? • We’re human! • We have fallibilities and produce errors when trying to estimate likelihoods and outcomes “We often think that when we have completed our study of “one” we know all about “two,” because “two” is “one and one.” We forget that we still have to make a study of “and.” -- Sir Arthur Eddington
Different Types of Cultures • Immature vs. Mature risk-view cultures • NOT termed “-averse” or “-seeking” here for a reason
Loss Analysis • What is the theory? • To get a better handle on risk! R = Pf x Mc How likely is it? How big is it?
Uncertainty in Risk • Uncertainty in estimates makes us less confident in our decisions • The “uncertainty path” of a hurricane shows visually how much we don’t know • More information could make a big difference
Magnitude in Risk • Magnitude gives us an estimate of the potential size of the outcome • Hindsight would have us avoiding or preventing all catastrophes (not possible!) • Very low probability, high magnitude events (Black Swan events) shape our world
Hazard-Loss Estimation • Any serious evaluation of risk takes into account the following four factors: • 1. Hazard • 2. Inventory • 3. Vulnerability • 4. Loss • A hazard’s potential impact on inventory is the inherent vulnerability • The vulnerability of the inventory gives a sense of the magnitude of loss
Active Advancement of Risk Methods • JPL – for Optimal Mars Entry, Descent, and Landing • Optimal sequential decisions within a specified risk bound • Not standard dynamic programming (achieves risk aversion by arbitrary penalties on failure states) • Instead uses “risk allocation” (RC-DP) to decompose a joint chance into a set of individual chance constraints and distributes risk over them. Reference: Ono, M. and Kuwata, Y. (2013). NASA Tech Briefs. Information Technology, 37(7), 52.
Further Extraterrestrial Example • Paths over Martian terrain NO DIFFERENT from paths through our latent risks! .28 .72 Overall certainty diminishes .38 .07 .81 .80 .10 .40 .45
Reference: Jet Propulsion Laboratory. (2013). Covariance Analysis Tool (G-CAT) for Computing Ascent, Descent, and Landing Errors. Software Tech Briefs.
Probability-Impact Matrix • First tool: Assess at a high-level with a probability-impact matrix • Uses horizontal resolution to maximum effect • 3 x 3 matrix can blur risks
OT-Matrix • This matrix layout does not overlook opportunities in the interest of threats (which is typical) P P I I
Ask “Why?” 7 ±2 Times to Get to Needed Action • Second tool: Understand the depth with 5 Whys
Fishbone Diagram • Third tool: Assess cause-and-effect structure with a Fishbone Diagram
Contradiction Matrix (Is/Is Not Analysis) • Fourth tool: Disambiguate with a Contradiction Matrix
FMEA • Fifth tool: Prioritize risks with Failure Modes and Effects Analysis • Caveat: It’s not a tool for every risk assessment – beware the Concreteness Fallacy • Sometimes with many factors and multiplicative scores, a weighted decision matrix (e.g., Pugh) works much better
Fallacies and Pitfalls • The Manager’s Fallacy • The Buyer’s Fallacy • The Fallacy of Control
Risk Perception • How do people perceive risk? • Not very logically, it turns out • Unfamiliar technologies with catastrophic potential (e.g., nuclear power) cause people to way overestimate risk Reference: Wordpress. (2009). UAE gets green light for nuclear power. Retrieved 13Jan10 from: http://seeker401.files.wordpress.com/2009/05/nuclear10b.jpg
Risk Reality • This misperception takes place at the expense of likelihood data • In a study where a group was faced with hypothetical managerial decisions, fewer than 1 in 4 asked for probabilistic information, none sought precise likelihood data • In a group presented with precise likelihood data, fewer than 1 in 5 drew upon probabilistic concepts when making choices about alternate courses of action Decide with evidence
Thinking Longer-Term • Consider this scenario: • A company is considering flood insurance for the 25-year life of a production facility • Managers are more likely to take seriously the risk of a 1-in-100 year flood if it’s presented as having greater than a 1-in-5 chance of occurring in a 25-year period, rather than a 1-in-100 chance of it occurring during the coming year
Using Evidence for Better Decisions • Homeowners in California purchased earthquake insurance most often after personally experiencing an earthquake, even though most responded (correctly) that the likelihood of another quake was lower now that stress on the geologic fault had been reduced • People generally dismiss low probability events unless they personally experience them Reference: NASA. (2009). Earth observatory. Retrieved 13Jan10 from: http://earthobservatory.nasa.gov/Newsroom/NasaNews/ReleaseImages/20041004/04_LOMA-Prieta2.jpg
9-11Aftermath • Research indicates the perception of risk has an enormous impact on behavior • After 9-11, how many people drove to avoid death by airliner who then died by automobile accident?
NeglectingProbabilities • The answer, it turns out, is a sobering 725 more people died than normal in the three months following 9-11 (October, November, and December) by increased driving habits Reference: Blalock, G., Kadiyali, V., Simon, D.H. (2005). The impact of 9/11 on driving fatalities: The other lives lost to terrorism. Ithaca, NY: Cornell University.
What 9-11 Did to Our Perception of Risk • The risk of suffering a fatal airline event is 1 in 9.4 billion miles traveled • The risk of suffering a fatal automobile event is 1 in 70.4 million miles traveled • An individual is thus 133 times more likely per mile traveled to have a fatal event driving versus flying References: NHTSA. (2009). Fatality analysis reporting system. Retrieved from: http://www-fars.nhtsa.dot.gov/Main/index.aspx. Sivak, M., Flannagan, M. (2002). Flying and driving after the September 11 attacks. UMTRI Research Review, 33(3). Ann Arbor, MI: University of Michigan.
Case Study – Unpublished Data • Sherlock holmes movie video clip http://www.youtube.com/watch?v=9b3KM2p1nHs
Uncertainty Distributions • Much like the beta-distribution (why?) • Uncertainty distributions (especially with small sample sizes) tend to be triangular or rectangular (uniform) distributions (all values equally likely – rolling a non-loaded die
Monte Carlo – Probability Distribution In-Practice • Monte Carlo integrates risk and uncertainty into schedule, is well-validated
Understanding Impact of Risk and Uncertainty on Project Schedule
Option Analysis – From Passive to Active • This could be patient recruitment or new hire recruitment
Option Analysis – From Passive to Active • When to visit Chicago? Reference: Vickers, A. (2010). What is a p-value anyway? Boston: Addison-Wesley, p. 78.
Uncertainty – How Much Don’t We Know? • “It is also true that for extremely rare events, correct uncertainty estimates may lead us to conclude that we know virtually nothing. This is not such a bad thing. If we really know nothing, we should say so!” Reference: Locwin, B. (2013). Quality Risk Assessment and Management Strategies for BioPharmaceuticals. BioProcess International. Forthcoming.
Uncertainty – How Much Don’t We Know? • Risk contour plot • Concreteness Fallacy SPC Slight Risk Climatology. Retrieved from: www.pmarshwx.com Relative risks?
Uncertainty – How Much Don’t We Know? • Study 1: Participants completed a health screening for Type 2 diabetes, took a survey either before or after choosing to learn their risk. Fewer in the contemplation group avoided learning their risks (χ2(1, N = 146) = 5.57, p < .02, Φ = .20. • Study 2: Participants completed a health screening for cardiovascular risk (CVD), completed another contemplation survey (or not). Fewer in the contemplation group avoided learning their risks (χ2(1, N = 130) = 10.05, p < .01, Φ = .28.) • Study 3: Participants learned about a fictitious disease (thioamine acetlyase (TAA) deficiency), the groups then either learned that the disease was treatable (by a pill) or not treatable. Completed another contemplation survey (or not). For those who learned TAA was treatable, fewer participants avoided learning their risks in the contemplation condition (χ2(1, N = 78) = 9.02, p = .003, Φ = .34). For those who learned TAA was untreatable, there was no difference between the two conditions (χ2(1, N = 80) = 1.75, p = .19, Φ = .14). Reference: Howell, J. L. & Sheppard, J.A. (2013). Reducing Health-Information Avoidance Through Contemplation. Psychological Science, X(X), 1-8.
Uncertainty – How Much Don’t We Know? • Reports that say that something hasn't happened are always interesting to me, because as we know, there are known knowns; there are things we know we know. We also know there are known unknowns; that is to say we know there are some things we do not know. But there are also unknown unknowns -- the ones we don't know we don't know. And if one looks throughout the history of our country and other free countries, it is the latter category that tend to be the difficult ones. • Donald Rumsfeld, United States Secretary of Defense, 2001-2006. Department of Defense briefing, 12 February 2002