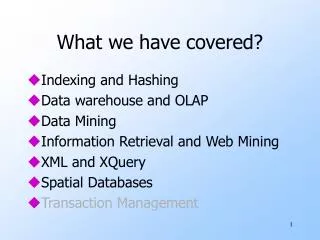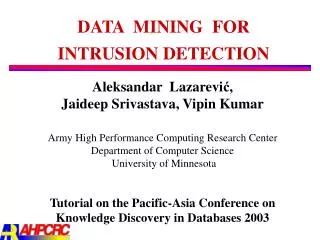
Understanding ID3 Algorithm in Data Mining: Classification and Pattern Discovery
This presentation by Prof. Sin-Min Lee delves into the ID3 algorithm, illustrating its role in data mining tasks like classification, estimation, and segmentation. Learn how to predict new data using established rules and patterns, visualize spatial relationships, and evaluate the effectiveness of discovered insights. The stages of data mining processes, such as data gathering, cleansing, feature extraction, and pattern discovery are explained. Through practical examples, including a decision tree structure, the complexities and applications of data mining techniques are systematically explored.

Understanding ID3 Algorithm in Data Mining: Classification and Pattern Discovery
E N D
Presentation Transcript
Data Mining-Knowledge Presentation—ID3 algorithm Lecture 19 Prof. Sin-Min Lee Department of Computer Science
Data Mining Tasks Predicting onto new data by using rules or patterns and behaviors • Classification • Estimation Understanding the groupings, trends, and characteristics of your customer • Segmentation Visualizing the Euclidean spatial relationships, trends, and patterns of your data • Description
Stages of Data Mining Process 1. Data gathering, e.g., data warehousing. 2. Data cleansing: eliminate errors and/or bogus data, e.g., patient fever = 125. 3. Feature extraction: obtaining only the interesting attributes of the data, e.g., “date acquired” is probably not useful for clustering celestial objects, as in Skycat. 4. Pattern extraction and discovery. This is the stage that is often thought of as “data mining” and is where we shall concentrate our effort. 5. Visualization of the data. 6. Evaluation of results; not every discovered fact is useful, or even true! Judgment is necessary before following your software's conclusions.
Clusters of Galaxies • Skycat clustered 2x10⁹ sky objects into stars, galaxies, quasars, etc. Each object was a point in a space of 7 dimensions, with each dimension representing radiation in one band of the spectrum. • The Sloan Sky Survey is a more ambitious attempt to catalog and cluster the entire visible universe
Clustering: Examples • Cholera outbreak in London
Decision trees are an alternative way of structuring rule information.
outlook overcast rain sunny humidity P windy normal true false N P N P
A Classification rule based on the tree if outlook = overcast then P if outlook = sunny & humidity = normal then P if outlook = rain & windy = false then P if outlook = overcast outlook = sunny & humidity = normal outlook = rain & windy = false then P
Each internal node tests an attribute Each branch corresponds to an attribute value node Each leaf node assigns a classification Outlook Sunny Overcast Rain Humidity High Normal No Yes
Top-Down Induction of Decision Trees ID3 • A the “best” decision attribute for next node • Assign A as decision attribute for node • 3. For each value of A create new descendant • Sort training examples to leaf node according to • the attribute value of the branch • If all training examples are perfectly classified (same value of target attribute) stop, else iterate over newleaf nodes.
[29+,35-] A1=? A2=? [29+,35-] True False True False [18+, 33-] [21+, 5-] [8+, 30-] [11+, 2-] Which Attribute is ”best”?
Entropy • S is a sample of training examples • p+ is the proportion of positive examples • p- is the proportion of negative examples • Entropy measures the impurity of S Entropy(S) = -p+ log2 p+ - p- log2 p-
Entropy • Entropy(S)= expected number of bits needed to encode class (+ or -) of randomly drawn members of S (under the optimal, shortest length-code) Why? • Information theory optimal length code assign –log2 p bits to messages having probability p. • So the expected number of bits to encode (+ or -) of random member of S: -p+ log2 p+ - p- log2 p-
[29+,35-] A1=? A2=? [29+,35-] True False True False [18+, 33-] [21+, 5-] [8+, 30-] [11+, 2-] Information Gain • Gain(S,A): expected reduction in entropy due to sorting S on attribute A Gain(S,A)=Entropy(S) - vvalues(A) |Sv|/|S| Entropy(Sv) Entropy([29+,35-]) = -29/64 log2 29/64 – 35/64 log2 35/64 = 0.99
[29+,35-] A1=? A2=? [29+,35-] True False True False [18+, 33-] [21+, 5-] [8+, 30-] [11+, 2-] Information Gain Entropy([18+,33-]) = 0.94 Entropy([8+,30-]) = 0.62 Gain(S,A2)=Entropy(S) -51/64*Entropy([18+,33-]) -13/64*Entropy([11+,2-]) =0.12 Entropy([21+,5-]) = 0.71 Entropy([8+,30-]) = 0.74 Gain(S,A1)=Entropy(S) -26/64*Entropy([21+,5-]) -38/64*Entropy([8+,30-]) =0.27
Selecting the Next Attribute S=[9+,5-] E=0.940 S=[9+,5-] E=0.940 Humidity Wind High Normal Weak Strong [3+, 4-] [6+, 1-] [6+, 2-] [3+, 3-] E=0.592 E=0.985 Gain(S,Wind) =0.940-(8/14)*0.811 – (6/14)*1.0 =0.048 Gain(S,Humidity) =0.940-(7/14)*0.985 – (7/14)*0.592 =0.151
Selecting the Next Attribute S=[9+,5-] E=0.940 Outlook Over cast Rain Sunny [3+, 2-] [2+, 3-] [4+, 0] E=0.971 E=0.971 E=0.0 Gain(S,Outlook) =0.940-(5/14)*0.971 -(4/14)*0.0 – (5/14)*0.0971 =0.247
ID3 Algorithm [D1,D2,…,D14] [9+,5-] Outlook Sunny Overcast Rain Ssunny=[D1,D2,D8,D9,D11] [2+,3-] [D3,D7,D12,D13] [4+,0-] [D4,D5,D6,D10,D14] [3+,2-] Yes ? ? Gain(Ssunny , Humidity)=0.970-(3/5)0.0 – 2/5(0.0) = 0.970 Gain(Ssunny , Temp.)=0.970-(2/5)0.0 –2/5(1.0)-(1/5)0.0 = 0.570 Gain(Ssunny , Wind)=0.970= -(2/5)1.0 – 3/5(0.918) = 0.019
Outlook Sunny Overcast Rain Humidity Yes Wind [D3,D7,D12,D13] High Normal Strong Weak No Yes No Yes [D6,D14] [D4,D5,D10] [D8,D9,D11] [D1,D2]
The ID3 Algorithm • Given • a set of disjoint target classes {C1, C2, …, Ck}, • a set of training data, S, containing objects of more than one class. • Let T be any test on a single attribute of the data, with O1, O2, …, On • representing the possible outcomes of applying T to any object x (written as T(x)). • T produces a partition {S1, S2, …, Sn} of S such that • Si = { x | T(x) = Oi}
S O2 … On O1 … S1 S2 Sn • Proceed recursively to replace each Si with a decision tree. • Crucial factor: Selecting the tests.
In making this decision, Quinlan employs the notion of uncertainty • (entropy from information theory). • M = {m1, m2, …, mn} Set of messages • p(mi) Probability of the message mi being received • I(mi) = -log p(mi) Amount of information of message mi • U(M) = i p(mi) I(mi) Uncertainty of the set M • Quinlan’s assumptions: • A correct decision tree for S will classify objects in the same proportion as their representation in S. • Given a case to classify, a test can be regarded as the source of a message about that case.
Let Ni be the number of cases in S that belong to a class Ci: p(cCi) = Ni / |S| The uncertainty, U(S), measures the average amount of information needed to determine the class of a random case, cS. Uncertainty measure after S has been partitioned. UT(S) = i (|Si| / |S|) U(Si) Select the test T that gains the most information, i.e., where GS(T) = U(S) – UT(S) is maximal.
Evaluation of ID3 • The ID3 algorithm tends to favor tests with a large number of outcomes • over tests with a smaller number. • Its computational complexity depends on the cost of choosing the next test to branch on; • It was adapted to deal with noisy and incomplete data; • It is a feasible alternative to knowledge elicitation if sufficient data of the right kind are available; • However this method is not incremental. • Further modification were introduced in C4.5, e.g : • pruning the decision tree in order to avoid overfitting • Better test selection heuristic
Search Space and Search Trees • Search space is logical space composed of • nodes are search states • links are all legal connections between search states • e.g. in chess, no link between states where W castles having previously moved K. • always just an abstraction • think of search algorithms trying to navigate this extremely complex space
Search Trees • Search trees do not summarise all possible searches • instead an abstraction of one possible search • Root is null state • edges represent one choice • e.g. to set value of A first • child nodes represent extensions • children give all possible choices • leaf nodes are solutions/failures • Example in SAT • algorithm detects failure early • need not pick same variables everywhere
Definition • A tree shaped structure that represents a set of decisions. These decisions are used as a basis for predictions. • They represent rules for classifying datasets. Useful knowledge can be extracted by this classification.