Download
1 / 22
220 likes | 344 Vues
Development of Coupled Physical and Ecological Models for Stress-Response Simulations of the Apalachicola Bay Regional Ecosystem. Co-Principal Investigators: • Dr. Mark Harwell • Dr. Ping Hsieh • Dr. Wenrui Huang • Dr. Elijah Johnson • Dr. Katherine Milla • Dr. Hongqing Wang

E N D
Development of Coupled Physical and Ecological Models for Stress-Response Simulations of the Apalachicola Bay Regional Ecosystem Co-Principal Investigators: • Dr. Mark Harwell • Dr. Ping Hsieh • Dr. Wenrui Huang • Dr. Elijah Johnson • Dr. Katherine Milla • Dr. Hongqing Wang • Dr. Glynnis Bugna • Dr. Kevin Dillon • Dr. Jack Gentile
Research Project Objective: To develop a coupled physical-ecological model of the Apalachicola Bay ecosystem that can be used as a quantitative tool to assess the ecosystem responses to natural and anthropogenic stressors
Apalachicola Bay River Management Forest Management Urbanization Development Navigation Water withdrawals Fire control Harvesting timber Etc. Septic Runoff Etc. Runoff Erosion Chemical releases Altered Salinity Regime Sedimentation Pathogens Nutrients Turbidity Mechanisms: Human consumption issues Mechanisms: Turbidity, Light D.O. Etc. Mechanisms: Salinity tolerances Invasive predators Mechanisms: Light availability Mechanisms: Enrichment Competition Habitat mosaic Distribution, pattern etc. of habitats Oyster Bars Areal extent Productivity, Closures Etc. Inter-Tidal Habitats Areal extent Mosaic, etc. Water Column Productivity Spp. Composition, Productivity, Etc.. Migratory Birds Abundance Distribution Beach/Dune Habitats Turtles, birds, other species Submerged Aquatic Vegetation Abundance, Distribution Health Soft-bottom Benthic Communities Infauna Epifauna, etc.
Apalachicola Bay Salt and Freshwater Marshes River Water Management Sea-Level Rise Development Navigation Water withdrawals Runoff Erosion Chemical releases Altered Flow Regime Changes in Water Quality Altered Salinity Regime Sedimentation Mechanisms: Burial Suffocation, Gill clogging Mechanisms: Low D.O. Reduced Light Etc. Mechanisms: Alter sediment type Erosion Altered salinity Mechanisms: Altered mean salinity Altered frequency of low salinity events Selected Species Abundance Health e.g., gators Turtles, Halophytes etc. Areal Extent Of Marshes Biogeochemical Processes Nutrient dynamics Decomposition, etc. Primary Production Spartina/Typha etc. Productivity Exotic Species Abundance Distribution e.g., Phragmites etc. Macroinvert. Community Abundance Diversity Water Quality Nutrients DO Turbidity, etc. Nursery Function Fish and Invertebrates
Research Tasks: Adopt 3-D hydrodynamic model to Apalachicola Bay (based on Princeton Ocean Model) Interface hydrodynamic model with EPA WASP WQ Model Calibrate MODBRNCH to Apalachicola River Ecological and WQ data gathering - using existing info, including high-resolution hyperspectral imaging Develop ecological models for salt marsh, oysters, and landscape systems Integrate data and models via GIS data layers Conduct demonstration ecological risk assessment
APALACHICOLA BAY WATER QUALITY MODEL RISK ASSESSMENT SCENARIOS SALT MARSH MODELS OYSTER MODEL APALACHICOLA BAY HYDRO- DYNAMIC MODEL APALACHICOLA BAY LANDSCAPE GIS HABITAT SUITABILITY MODEL APALACHICOLA RIVER MODEL Modeling Framework for Coupled Apalachicola System
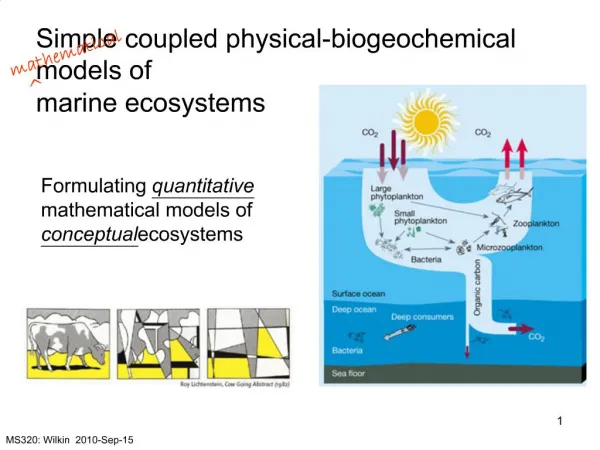
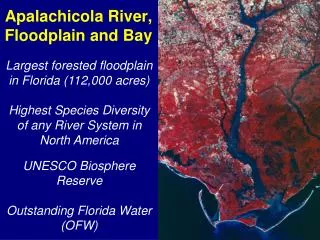
Characteristicsof Apalachicola Bay • Shallow water, multiple tidal boundaries. • Strong freshwater discharge: Qmin=155 m3, Qave=770 m3, Qmax=2300 m3. • River discharge perpendicular to the estuarine axis and a long barrier island. • Strong vertical stratification near the river.
The Hydrodynamic Model • Princeton Ocean Model (POM) (Blumberg and Mellor, 1987) • Semi-implicit, finite-difference method • Second-order turbulent closure (Mellor and Yamada)
SUMMARY • Model is calibrated to simulate 3D hydrodynamics and salinity in the Bay. • Estuary’s characteristics: a) multiple tidal forces with different amplitudes, b) strong river discharge perpendicular to the estuarine axis, c) shallow water.