Download
1 / 12
200 likes | 847 Vues
Modeling & Simulation Life Cycle. Life Cycle and Case Study. M&S Life Cycle. So far, we’ve focused primarily on issues concerning model execution This is only one aspect of a simulation study The M&S life cycle refers to the steps that take place during the course of a simulation study

E N D
Modeling & Simulation Life Cycle Life Cycle and Case Study
M&S Life Cycle • So far, we’ve focused primarily on issues concerning model execution • This is only one aspect of a simulation study • The M&S life cycle refers to the steps that take place during the course of a simulation study • In practice, not all of these steps are always followed, but one should keep in mind the overall process and be aware of potential consequences when certain steps are skipped
Life Cycle for a Simulation Study • Problem formulation • Develop conceptual model, collect data • Validate conceptual model • Develop simulation • Verify, validate simulation • Design experiments • Make production runs • Analyze output data • Document, present results Reference: A. M. Law and W. D. Kelton, Simulation Modeling and Analysis, Third Edition, McGraw Hill, 2000.
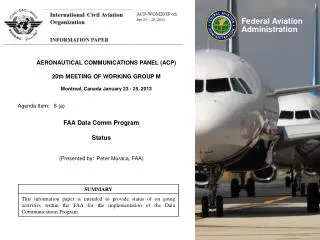
Case Study • Air traffic control study performed by Mitre Corp. for the Federal Aviation Administration • Studies used to plan changes in the structure and/or management of the National Airspace System (NAS) • New airports or runways • Changes in operating procedures • Reference: William W. Trigeiro, “Impact of Regional Jets on Congestion in the NAS,” Mitre Center for Advanced Aviation System Development (CASSD), MP98W0000256V3, February 1999. • Software • Detailed Policy Assessment Tool (DPAT) • Georgia Tech Time Warp (GTW)
Problem Formulation • State objectives, questions to be answered • Need agreement by analysts and policy makers • Define performance metrics • Develop overall plan, schedule, milestones • Case study • Increased use of regional jets (RJs) rather than propeller-driven aircraft (props) by airlines • Aircraft w/ 32-90 seats, typically used by regional airlines • Preferred by travelers: faster, quieter, perceived quality/safety • RJs fly at higher altitudes, compete with regular jets for airspace • Goal: “provide a ‘heads up’ to aviation planners… through 2003” of impact of RJs on congestion in the NAS • Two phase plan • Analyze airline industry to assess current and future use of RJs to develop scenario for December 2003 time frame • Construct airline schedule based on scenario and perform simulation study to evaluate impact on congestion
Conceptual Model & Data Collection • Develop conceptual model of system, analyze current and planned practices and system configurations • Understand existing system and operating procedures as well as changes under consideration • Validate conceptual model (e.g., walk through with analysts, managers, subject matter experts) • Case Study • Analysis of airline industry • Start with existing airline schedules (Feb ‘98) • Literature search, airline announcements, plans of RJ manufacturers, FAA forecasts • Pilot union contracts restrict number and usage of RJs by airline, limiting growth of RJ traffic • Projected 800 RJs in use by 2003 • Projected RJ schedules • Airlines would not release specific plans on RJ usage, retirement of prop aircraft; assume current strategies for RJ use remain valid • Replace turbo props on existing routes with RJs • Add new routes to “hub-and-spoke” structure exploiting increased speed and range of RJs
Conceptual Model (cont.) • Case Study • Simulation model • Variety of simulation models exist • Detailed models capturing behavior of individual aircraft • Coarser queueing-based models of NAS • Queueing-based models used for this study • Conceptual model validation (partial) • Tracked actual RJ procurement plans of airlines • >200 RJs in service, firm orders for 500, options for 660 in 1999 • Concluded aggregate model traffic load is conservative • More uncertainty in projected future RJ routes and schedules
Simulation Software • Software options • Program in general purpose language (e.g., C or C++) • Simulation software package (e.g., Arena) • Case study • Several simulation packages already exist • Mitre - Detailed Policy Assessment Tool (DPAT) • Preston Group - Total Airspace and Airport Modeler (TAAM) • Numerous others • DPAT used in this study • Designed to predict system-wide delays resulting from congestion, weather, system outages, growth of system • Built over Georgia Tech Time Warp parallel simulation executive • Typical scenario (a day) of NAS simulated in under a minute • 1250 Logical Processes (520 airports, 730 airspace sectors) • Approximately 500K events per run
Verification and Validation • Verification: Is the simulation software correct? • Software debugging • Validation: Does the simulation model give an accurate representation of the modeled system? • Do the outputs “make sense”? • Calibrate: iterative procedure involving comparing model predictions with an operational systems (or another model of the operational system), and modifying (tuning) model to improve accuracy • Sensitivity analysis: determine which factors have a large effect on performance measures • Case Study • Specifics not given (except growth in RJ use) • DPAT verified and validated separately
Experiment Design • Specify what simulation runs are to be performed • Select scenarios, system configurations • Length of run; warm up period • Number of replications (independent runs) using different random number streams to establish confidence intervals • Case study • Scenarios using projected schedules for December 2003 • Weather effects and other external events not simulated • Details of runs (number of trials, etc.) not specified
Output Analysis • Output Analysis • Collect simulation results from sets of runs • What does it mean? • Case Study • Nine (out of 20) U.S. Air Route Traffic Control Centers (in Michigan/Florida/Texas triangle) will see traffic growth exceeding national averages • Largest growth in Indianapolis Center, then Cleveland and Dallas/Fort Worth • Significant congestion predicted in sectors north of Cincinnati • RJs will have minimal impact in western U.S.
Concluding Remarks • A successful simulation study involves many other steps in addition to developing and running the simulation model • Inclusion of many individuals necessary to ensure the study is valid, and to promote “buy in” by decision makers and others • Don’t blindly believe the simulation results!