Download
1 / 9
90 likes | 237 Vues
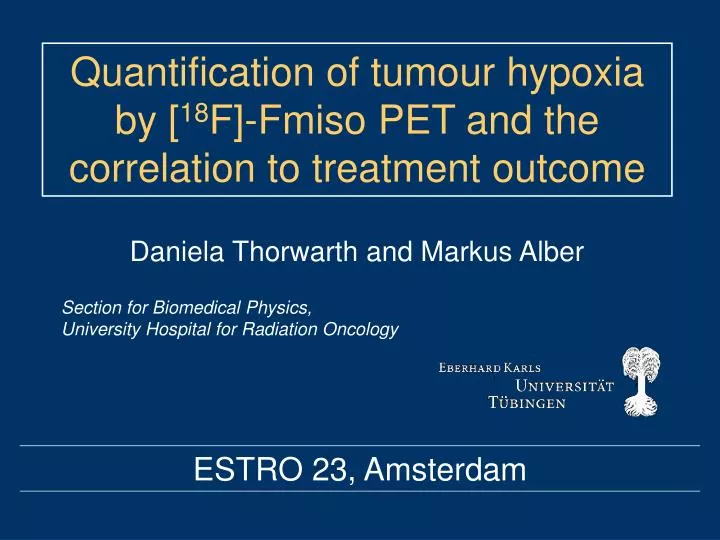
Quantification of tumour hypoxia by [ 18 F]-Fmiso PET and the correlation to treatment outcome. Daniela Thorwarth and Markus Alber. Section for Biomedical Physics, University Hospital for Radiation Oncology. ESTRO 23, Amsterdam. A(t) [kBq/cc]. 10. 0. 20. 10. FDG. Fmiso (4h p.i.). 0. 0.

E N D
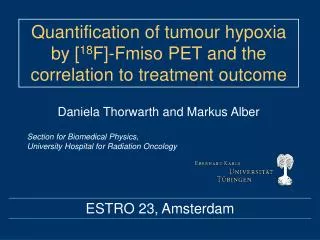
Quantification of tumour hypoxia by [18F]-Fmiso PET and the correlation to treatment outcome Daniela Thorwarth and Markus Alber Section for Biomedical Physics, University Hospital for Radiation Oncology ESTRO 23, Amsterdam
A(t) [kBq/cc] 10 0 20 10 FDG Fmiso (4h p.i.) 0 0 50 100 150 200 t[min] Dynamic Fmiso PET scans show different characteristic Time-Activity-Curves (TACs) Imaging hypoxia with [18F]-Fmiso [18F]- Fluoromisonidazole (Fmiso) accumulates selectively in tissue areas with low pO2 (≤10 mmHg)
Analysis of Fmiso PET images A(t) [Bq/cc] Hypoxia criterion based on tumour-to-blood ratio ≥1.4 not reliable t [min] Kinetic analysis of the TACs is necessary
fractional tumour volume accumu-lating Fmiso Compartment Model tissue fraction containing freely diffusive Fmiso k1 k2 k3 Fmiso content in the blood pool
SCCNij 57 Perfusion SCCNij 107 A(t)[Bq/cc] Hypoxia SCCNij 51 Hypoxia /Necrosis J. Kaanders, UMC Nijmegen t [min] Charac-teristic shapes of TACs correspond to different structural architectures of the tumour
Perfusion Decomposition determines thegrade ofPerfusionin the respectivetissue area Hypoxia concentration of Hypoxia in the considered volume Hypoxia/Necrosis diffusive compartment A(t) [Bq/cc] t [min]
Scatter Plot Different Regions in Parameter Space correspond to characteristic TACs level of perfusion concentration of hypoxia perfusion hypoxia hypoxia/necrosis
without local recurrence local recurrence Pat. 1 Pat.2 Pat. 7 Pat. 8 Pat. 3 Pat. 4 Pat. 9 Pat. 10 Pat. 5 Pat. 6 Pat. 11 Pat. 12 perfusion Pat. 13 Pat. 14 hypoxia concentration
without local recurrence local recurrence Pat. 1 Pat.2 Pat. 7 Pat. 8 Pat. 3 Pat. 4 Pat. 9 Pat. 10 ? Pat. 5 Pat. 6 Pat. 11 Pat. 12 perfusion Pat. 13 Pat. 14 ? dose painting ? hypoxia concentration