Download
1 / 22
220 likes | 325 Vues
Marine Ecosystem Simulations in the Community Climate System Model Keith Moore University of California, Irvine Scott Doney (WHOI), Keith Lindsay (NCAR), Ivan Lima (WHOI). Dust inputs from Mahowald (NCAR) and Zender (UCI) groups. Community Climate System Model (CCSM v2) ocean only mode.

E N D
Marine Ecosystem Simulations in the Community Climate System Model Keith Moore University of California, Irvine Scott Doney (WHOI), Keith Lindsay (NCAR), Ivan Lima (WHOI). Dust inputs from Mahowald (NCAR) and Zender (UCI) groups.
Community Climate System Model (CCSM v2) ocean only mode. Longitudinal resolution ~ 3.6 degrees Latitudinal resolution ~ 2 degrees decreasing to ~ 1 degree near the equator 25 vertical levels (5 in the upper 111m) that increase in size with depth. Circulation spin up of 420 years, Ocean forced with repeating 4 year atmospheric cycle based on NCEP/NCAR reanalysis for 1985-89. Monthly dust deposition from Luo, Mahowald, del Corral (2003), climatology for 1979-2000 period
Original ecosystem model developed within a simple physical model included only the surface mixed layer on a global grid. Subsurface nutrient concentrations fixed to climatology. Model described in two Deep Sea Research papers, at: http:/www.ess.uci.edu/~jkmoore.html For CCSM implementation sinking particle dynamics and remineralization profiles must be specified. Adopted the model mineral ballast and modified iron parameterizations, and reduced tracers by fixing some elemental ratios. Submitted ms at: http:/www.ess.uci.edu/~jkmoore.html
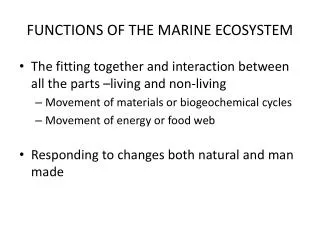
Multiple growth limiting nutrients (N, P, Fe, and Si) Includes key phytoplankton functional groups known to be drivers of marine carbon fluxes Diatoms - Si requirement, often dominate blooms and C export out of surface waters, C to deep ocean Coccolithophores - CaCO3 platelets, often dominate non-diatom blooms, C export to deep ocean Diazotrophs - Capable of nitrogen fixation (N2 gas), new nitrogen source, ecosystems P vs. N limited Pico/nanoplankton - smaller species, "background community", efficient C recycling with less export
Fixed C/N/P ratios Variable Fe/C, Chl/C, Si/C ratios
Phytoplankton Group Distinctions Grazing Pressure: Small Phytoplankton > Diatoms > Diazotrophs Nutrient Uptake Efficiency: Small Phytoplankton >> Diatoms & Diazotrophs Iron Requirements (optimum Fe/C ratios): Diazotrophs 48 μmol/mol, Others 6 μmol/mol Light Utilization Efficiency: Diatoms > Small Phytoplankton >> Diazotrophs Growth: Diatoms & Small Phytoplankton >> Diazotrophs
Remineralization in the Deep Ocean Armstrong et al. (2002) - "mineral ballast" hypothesis for organic carbon transport to the deep ocean. Mineral Ballasts = dust, CaCO3, and biogenic Silica 1) Each ballast has a "hard" and "soft" fraction. 2) Hard fraction has very long remineralization length scale so most of this material reaches the sea floor. 3) Soft fraction remineralizes in upper ocean with a length scale of ~600m. 4) Soft Fraction - Mineral Dust 3%, bSi & CaCO3 40%
Remineralization in the Deep Ocean Particulate Organic Carbon (POC) is classified as bound to mineral ballast or as unbound POC. The unbound POC remineralizes with a temperature dependent length scale that varies as function of temperature (< 100m at warmest temperatures, to > 600m at coldest temperatures). The bound POC (small fraction of total) shares the remineraliztion profile of the ballast material. Organic Carbon / mineral ballast ratio varies with ballast. Parameter values are not well constrained, ongoing work is attempting to optimize.
Marine Iron Cycle Main source to open ocean is from mineral dust. Model includes surface and sub-surface dissolution. Coastal/shelf sediments also supply iron. Dissolved iron is removed by two key processes: 1) biological uptake 2) adsorption/scavenging onto particles Process #2 leads to sub-surface nutrient fields being iron-deficient relative to the macro-nutrients. Field observations within narrow range (~0.05 - 0.7 nM). Inputs vary by orders of magnitude.
Marine Iron Cycle Most dissolved iron in situ is bound to organic ligands which strongly influence particle reactivity and scavenging loss rates. Scavenging loss is parameterized as a function of: 1) # of particles available (dust and POC) 2) ambient dissolved iron concentrations scavenging is decreased when dFe < 0.4 nM fe_scav = fe_scav * dFe/0.4, and rapidly increases above 0.6 nM 90% of scavenged iron is lost to sediments, 10% to sinking particulates, can remineralize at depth.
Summer Season Growth Limitation Diatoms Small Phytoplankton & Coccolithophores Diazotrophs
Spatial patterns in good agreement with field observations. Total nitrogen fixation low by a factor of 2-3.
Particulate Organic Carbon Biogenic Silica from Diatoms CaCO3 from Coccolithophores
Sensitivity to Atmospheric Iron Input Variability PrimaryP ExportP Nitrogen Fixation ______________GtC Gt C_____Tg N Dust*0.25 39.5 4.55 34.3 Dust*0.5 41.8 5.00 43.1 Standard Run 43.8 5.63 54.2 Dust*2.0 44.2 6.20 66.1 Dust*4.0 __ 44.8 6.66 76.5 Primary production, carbon export, and nitrogen fixation are all significantly influenced by large variations in atmospheric iron inputs.
Nitrogen Fixation and Ocean Biogeochemical Cycling Diazotrophs account for ~0.5% of primary production. PP ExpC N Fix Standard Run 43.8 5.63 54.2 No Diazotrophs 39.4 5.20 0.0 Nitrogen fixation supports ~10 % of primary production and ~ 8 % of export production in standard run. At ~50 TgN/yr, our nitrogen fixation is on the low end of current observational estimates. Thus, the global impact of N-fixation on the carbon cycle is underestimated.
Ongoing and Future Work Add denitrification/nitrification loss for nitrogen. Allow for variable C/N/P ratios in sinking export. Optimize the mineral ballast model parameters. Ocean only equilibrium run. Coupled atmosphere/dust/ocean simulations. CCSM 3 global coupled carbon simulations. Atmospheric nutrient deposition (Fe, N, P, Si). Nutrient inputs from river outflow (Fe, N, P, Si). Incorporate ocean sediment biogeochemical component.