Download
1 / 9
90 likes | 102 Vues
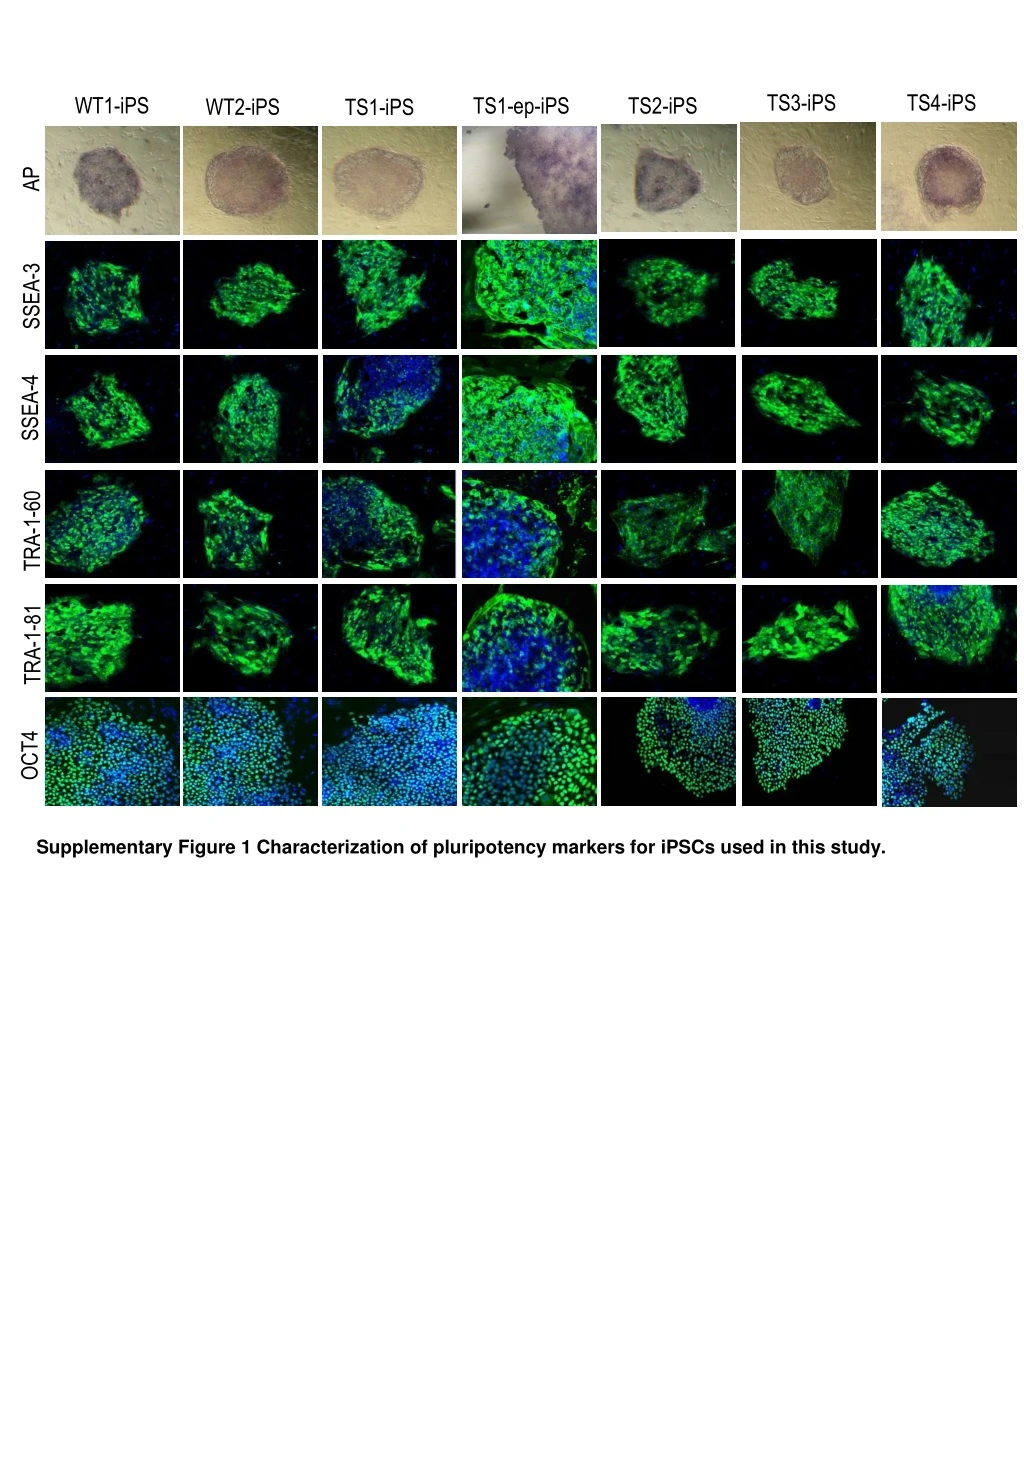
TS3-iPS. TS4-iPS. WT1-iPS. TS1-ep-iPS. TS2-iPS. WT2-iPS. TS1-iPS. AP. SSEA-3. SSEA-4. TRA-1-60. TRA-1-81. OCT4. Supplementary Figure 1 Characterization of pluripotency markers for iPSCs used in this study. TS4-iPS. WT1-iPS. WT2-iPS. TS2-iPS. TS3-iPS. TS1-iPS. TS1-ep-iPS. EBs.

E N D
TS3-iPS TS4-iPS WT1-iPS TS1-ep-iPS TS2-iPS WT2-iPS TS1-iPS AP SSEA-3 SSEA-4 TRA-1-60 TRA-1-81 OCT4 Supplementary Figure 1 Characterization of pluripotency markers for iPSCs used in this study.
TS4-iPS WT1-iPS WT2-iPS TS2-iPS TS3-iPS TS1-iPS TS1-ep-iPS EBs AFP Nestin SMA Supplementary Figure 2 Embryoid body differentiation from iPSCs used in this study.
TS1-ep-iPS TS2-iPS TS3-iPS TS4-iPS WT1 iPS WT2 iPS TS1-iPS Ectoderm Mesoderm Endoderm Supplementary Figure 3 Teratoma formation from iPSCs used in this study.
a b Supplementary Figure 4 No expression of exogenous reprogramming genes in iPSCs. qPCR analyses for (a) Endogenous pluripotency markers expression in iPSCs. (b) Exogenous reprogramming gene expression in iPSCs.
a TS1-iPS clone 1, p6 TS1-iPS clone 2, p6 TS1-iPS clone 3, p8 TS1-iPS clone 4, p9 b TS1-ep-iPS clone5, p6 TS1-ep-iPS clone 6, p6 TS1-ep-iPS clone 7, p8 TS1-ep-iPS clone 8, p9 c TS2-iPS clone1, p6 TS2-iPS clone2, p6 TS2-iPS clone 3, p8 TS2-iPS clone 4, p9 d TS3-iPS clone 4, p9 TS3-iPS clone1, p6 TS3-iPS clone 3, p8 TS3-iPS clone2, p6 e TS4-iPS clone 4, p9 TS4-iPS clone 3, p8 TS4-iPS clone1, p6 TS4-iPS clone2, p6 Supplementary Figure 5 Karyotypes of TS iPSCs used in this study. Representative karyotypes of (a) TS1 iPSC clones, (b) TS1 iPSC clones by episomal reprogramming, (c) TS2 iPSC clones, (d) TS3 iPSC clones and (e) TS4 iPSC clones.
a TS1-fib p5 TS1-fib p9 b TS1-iPS clone2 p7 TS1-iPS clone1 p5 TS1-iPS clone3 p8 c TS1-ep-iPS clone5 p5 TS1-ep-iPS clone6 p6 TS1-ep-iPS clone7 p6 Supplementary Figure 6 FISH for X chromosome copy number in TS1 fibroblasts and iPSCs. Representative FISH signal patterns of (a) TS1 fibroblasts, (b) TS1 iPSC clones, (c) TS1 iPSC clones by episomal reprogramming.
Supplementary Figure 7 Principal component analysis of SNPs on the 22 autosomes of WT1, TS1 and TS2 fibroblasts and TS1 iPSCs.
a TS1-iPS clone2 p12 TS1-iPS clone3 p12 TS1-iPS clone1 p12 WT1-iPS clone1 p9 WT2-iPS cone1 p15 b TS3-iPS clone1 p13 TS4-iPS clone1 p7 TS2-iPS clone1 p10 WT1-iPS clone1 p9 WT2-iPS cone1 p15 Supplementary Figure 8 Scatter plots showing differential expressed genes between WT and TS iPSCs. (a) Differential expressed genes between WT iPSCs (WT1 and WT2 iPSCs) and TS1 iPSC clones. (b) Differential expressed genes between WT iPSCs and unaltered TS iPSCs (TS2, TS3 and TS4 iPSCs). Red dots indicate genes upregulated by 2 folds; green dots indicate genes downregulated by 2 folds.
* * * * * * * * * Supplementary Figure 9 qPCR analysis for differentially expressed cell cycle genes in WT group, TS1 group and uncorrected TS group iPSCs.Error bars represent SD. * P<0.001, uncorrected TS group versus WT+TS1 group by ANOVA.