Download
1 / 61
610 likes | 717 Vues
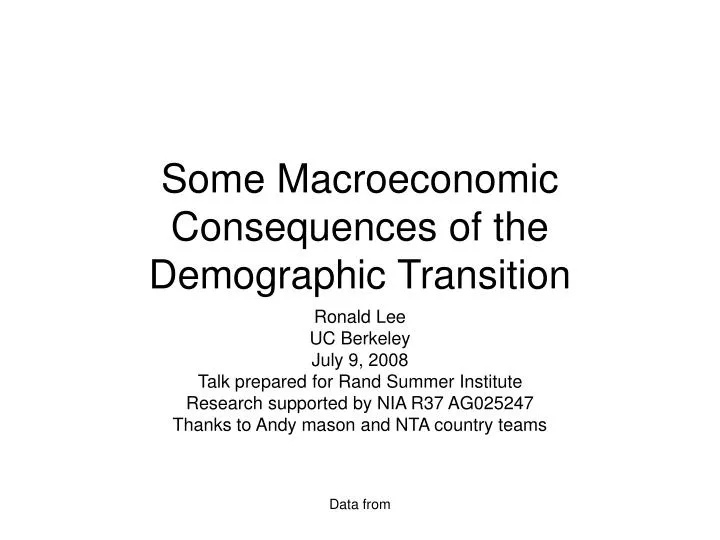
Some Macroeconomic Consequences of the Demographic Transition. Ronald Lee UC Berkeley July 9, 2008 Talk prepared for Rand Summer Institute Research supported by NIA R37 AG025247 Thanks to Andy mason and NTA country teams . Main points.

E N D
Some Macroeconomic Consequences of the Demographic Transition Ronald Lee UC Berkeley July 9, 2008 Talk prepared for Rand Summer Institute Research supported by NIA R37 AG025247 Thanks to Andy mason and NTA country teams Data from
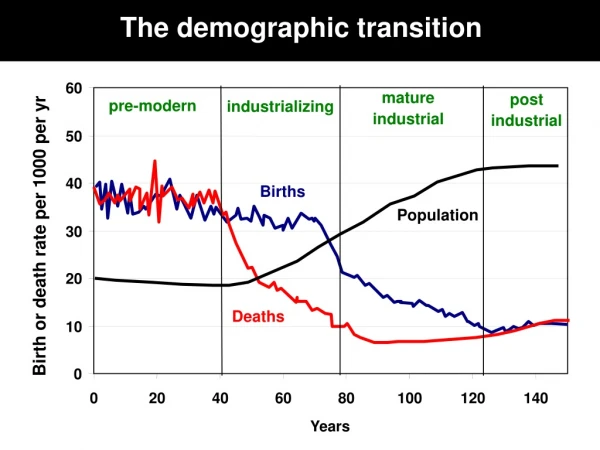
Main points • Demographic transition first raises support ratio, then with population aging reduces it. • Per capita consumption is proportionate to Support ratios, other things equal. “First dividend”, pop aging. • Longer life, lower fertility, slower pop growth and older population all raise capital/labor ratio, raising labor productivity. “Second dividend”. • This depends on importance of assets vs transfers. • Lower fertility goes with greater investment in human capital per child, raising labor productivity. Data from
Latin American NTA team leaders • Brazil: Cassio M. Turra and Bernardo Lanza Queiroz • Chile: Dirk Jaspers and Jorge Bravo; (Tim Miller, Mauricio Holz) • Uruguay: Marisa Bucheli • Mexico: Iván Mejía Guevara and Juan Enrique García • Cost Rica: Luis Rosero Bixby Data from
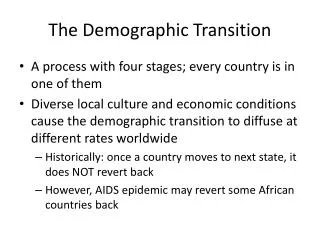
I. The Demographic Transition • A classic illustration: The transition in India, 1890-2100. • Mixture of historical estimates, UN projections, and simulation based on fitted variations with time. Data from
Pre fertility decline; child dependency ratio rises During fertility decline, child dependency ratio declines Population aging: old age dep ratio rises Data from
The total dep ratio rises, falls, then rises again, ending up where it started. The changes in the total dependency ratio are transitory. Data from
But there is a big permanent change: At start, many children and few elderly. At end, few children and Many elderly. Data from
Comments on simulation • Assumed TFR stabilized at 2.1; but often has declined below replacement. • Assumed e0 stopped rising at 80, but many countries already above this. • Some countries experienced important baby booms and busts which distort this classic shape. • Many countries now have declining populations and declining working age pops. Data from
II. The economic life cycle: • Age profiles of consumption and labor income • Use estimates from the National Transfer Accounts project, or NTA. • Consumption patterns are quite similar for Third World countries in Asia and Latin America. • Consumption in Industrial populations looks different. Data from
Includes self employment, wages,unpaid family labor, & fringe benefits. Averages 0’s and both male and female. Includes both private expends and in-kind public transfers (health, education, long term care) Data from An-Chi Tung
Flat cons age profile in adult years reflects extended family sharing. Quite different than most industrial nations. Data from An-Chi Tung
Large deficits at young and old ages. Data from An-Chi Tung
Reallocations from surplus to deficit ages required. Data from An-Chi Tung
Other income comes from assets, foreign loans, and remittances from abroad—it’s not all labor income. Data from An-Chi Tung
Asset income is partic Impt for old age Data from An-Chi Tung
National Transfer Accounts data Rich poor Data from
Components of US Consumption, 2003 Unlike Taiwan and other Third World, in US cons rises strongly with age. True in other industrial too. Later I will measure HK investment As sum of pub and priv spending on hlth and educ as shown here. Data from
Many policy possibilities to change the age profiles • Change the age profile of labor income • Later retirement • Earlier entry into labor force • Higher female labor force participation • Reform seniority system • Change the age profile of consumption • In many industrial nations, the elderly consume much more than younger adults. • Makes population aging more costly • Role of public transfer policy: pensions, health care, long term care • Change the demographic trends: immig, fert
Levels of age profiles change fast with economic development. • Shapes of age profiles change slowly, • Are broadly similar across countries at very different levels of development.
III. Dependency and Support • Concern about pop aging is mostly about old age dependency. • Sharpest concerns for age-sensitive public sector programs • pensions • health care • Long term care • But should place these in broader context • Full range of public programs • Private consumption • Use shape of estimated profile I just showed.
Support Ratios • Effective labor is weighted sum of pop using labor income age profile. • Effective consumers is similar. • Ratio of effective labor to effective consumers is the “Support Ratio”. • Other things equal, consumption per effective consumer is proportional to the support ratio.
Population aging First Dividend
IV. Further on Interage Flows of Income • Comparison of Japan and Indonesia
Per capita consumption and labor income by age for Indonesia and Japan • Differences in consumption • Education in Japan • Rising consumption in old age in Japan Indonesia, 2002 Japan, 2004 Data from Maliki (Indonesia) and H. Ogawa (Japan)
Here are the aggregate flows: population by age times per capita age profiles Data from Maliki (Indonesia) and H. Ogawa (Japan)
Aggregate flows • Green arrows show transfers from surplus of prime working years. • Red arrows show asset income consumed by elderly out of earlier savings. Data from Maliki (Indonesia) and H. Ogawa (Japan)
Aggregate flows • Suppose the same proportion of old age consumption is funded by assets. • Then assets per capita will be much higher in Japan • If held in domestic investment, then capital labor ratio will be higher too. Data from Maliki (Indonesia) and H. Ogawa (Japan)
The demand for wealth rises over the demographic transition. • Why? • Older people hold more wealth; in old population, there are more of them. • Also: • Longer life means workers need to accumulate more wealth for longer old age. • Lower fertility means adults consume more and need to save more to maintain in old age.
VI. The role of intergenerational transfers • We just considered the wealth needed to achieve consumption targets. • Wealth can be held in two forms: • Transfer wealth (expected future transfers received minus expected future transfers made) • Assets or Capital
NTA data on shares of old age support from different sources • Asset income (land, equities, interest, etc.) • Family transfers (not including bequests at death) • Public transfers (Pay As You Go pensions, health care, and long term care) • Triangle graph shows shares, not levels, so must add to 100%. • Bequests not included; just old age cons.
Familial transfers equally important in Thailand, Korea, and Taiwan (36-40%). Net public transfers to elderly are zero in Thailand; about 25% in Taiwan and Korea. Net familial transfers near zero in US, CR, and J. Large public transfers in CR and J Diagram from Andy Mason
Public transfers: Thailand none, Japan and Costa Rica around 70% US, Korea, Taiwan, middling Diagram from Andy Mason
Reliance on assets : Japan, Taiwan, C.R. are low; Thailand high; US middling Diagram from Andy Mason
VII. Demographic Transition and Capital Accumulation • Changing dependency gets most attention for ec dev and pop aging. • Changes in capital accumulation may be more important.
Calculating the demand for wealth and capital over the demographic transition • Based on different theoretical models, approaches. • Model with Social Planner maximizing discounted social welfare function with full foresight. • Model with individuals saving and consuming over their life cycles to maximize their life time utility.
Here take a different approach – no optimization--emphasizes institutional setting • Assume • share of old age consumption supported by asset income stays constant over time. • altruistic sharing maintains the shape of the cross sectional consumption age profile. • Demography is known in advance. • Can solve recursively for unique growth path and asset holdings.
Two scenarios: high level of transfers to elderly (65%); or low level (35%) • Other assumptions • Productivity growth raises income age profile by 2% per year. • Open economy; rate of return on assets is 3%. • Aggregate saving is calculated to maintain asset share of old age consumption support. • Results will be shown relative to a 2% growth trajectory from prod gr.
Simulated Saving Rate, ASEAN (S.E. Asian countries), 1950-2050 From Mason, Lee and Lee (2008)
Simulated Assets/Labor Income, ASEAN Ratio of assets to labor income rises greatly in any case, but 3 or 4 times as much with low IG transfers. From Mason, Lee and Lee (2008)
Simulated Consumption, ASEAN With low IG transfers, saving is higher from 1990 to 2020, reducing consumption. Thereafter, it is higher. From Mason, Lee and Lee (2008)
These sorts of results are qualitatively like those from optimization approaches • Timing of swings differs • Level of savings rates differs • Capital/labor income ratios differ Big picture is the same: • The demographic transition leads to a major increase in capital per worker. • The greater the role of transfers to the elderly, the smaller is the increase in capital intensity. • Eventually consumption rises with lower transfers, but initially it is lower. • Population aging leads to a decline in savings rates but an increase in capital intensity.
VIII. Human capital and the demographic transition • Measure public and private expenditures on health and education at each age. • Sum these for health ages 0-18 • Sum for education ages 0-26 • Gives synthetic cohort HK investment per child • Construct ratio of HK to average yl(x)= , ages 30-49. • Plot log of HK/ against log of TFR.
y = -1.05*x + 1.92 R2 = 0.62 Data from NTA country teams