Download
1 / 19
190 likes | 374 Vues
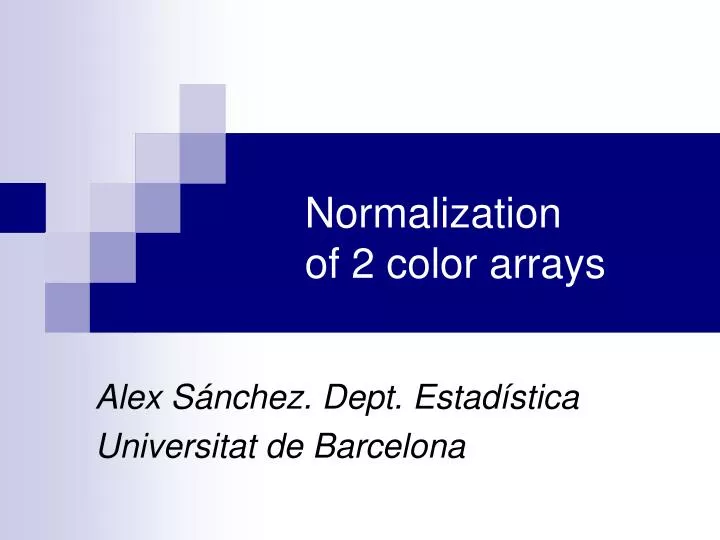
Normalization of 2 color arrays. Alex Sánchez. Dept. Estadística Universitat de Barcelona. Microarray studies life cycle. Here we are. What is normalization?. The word normalization describes techniques used to suitably transform the data before they are analysed.

E N D
Normalization of 2 color arrays Alex Sánchez. Dept. Estadística Universitat de Barcelona
Microarray studies life cycle Here we are
What is normalization? • The word normalization describes techniques used to suitably transform the data before they are analysed. • Goal is to correct for systematic differences • between samples on the same slide, or • between slides, which do not represent true biological variation between samples.
The origin of systematic differences • Systematic differences may be due to … • Dye biases which vary with spot intensity, • Location on the array, • Plate origin, • Printing quality which may vary between • Pins • Time of printing • Scanning parameters,…
How to know if it’s necessary? • Option 1: to perform self-self normalization • If we hibridize a sample with itself instead of sample vs control intensities should be the same in both channels • All deviations from this equality means there is systematic bias that needs correction • Option 2: Look at diagnostic plots for dye, slide or spatial effects
Self-self hybridizations False color overlay Boxplots within pin-groups Scatter (MA-)plots
Some non self-self hybridizations From the NCI60 data set Early Ngai lab, UC Berkeley Early Goodman lab, UC Berkeley Early PMCRI, Melbourne Australia
Normalization methods & issues • Methods • Global adjustment • Intensity dependent normalization • Within print-tip group normalization • And many other… • Selection of spots for normalization
Global normalization • Based on a global adjustment log2 R/G log2 R/G - c = log2 R/(kg) • Choices for k or c = log2k are • c = median or mean of log ratios for a particular gene set • All genes or control or housekeeping genes. • Total intensity normalization, where • K = ∑Ri/ ∑Gi.
Intensity-dependent normalization • Run a line through the middle of the MA plot, shifting the M value of the pair (A,M) by c=c(A), i.e. log2 R/G log2 R/G - c (A) = log2 R/(k(A)G). • One estimate of c(A) is made using the LOWESS function of Cleveland (1979): LOcally WEighted Scatterplot Smoothing.
Example: (Callow et al 2002)Global median normalization. • Global normalization performs a global correction but it cannot account for spatial effects • See next slide boxplots for the same situations in only one mouse, showing all sectors
Global normalisation does not correct spatial bias (print-tip-sectors)
Within print-tip group normalization • To correct for spatial bias produced by hybridization artefacts or print-tip or plate effects during the construction of arrays. • To correct for both print-tip and intensity-dependent bias perform LOWESS fits to the data within print-tip groups, i.e. • Log2 R/G log2 R/G - ci(A) = log2 R/(ki(A)G), where ci(A) is the LOWESS fit to the MA-plot for the ith grid only.
Local print-tip normalisation corrects spatial bias (print-tip-sectors)
Normalization, which spots to use? • LOWESS can be run through many different sets of points, • All genes on the array. • Constantly expressed genes (housekeeping). • Controls. • Spiked controls (genes from distant species). • Genomic DNA titration series. • Rank invariant set.
Strategies for selecting a set of spots for normalization • Use of a global LOWESS approach can be justified by supposing that, when stratified by mRNA abundance, • Only a minority of genes expected to be differentially expressed, • Any differential expression is as likely to be up-regulation as down-regulation. • Pin-group LOWESS requires stronger assumptions: that one of the above applies within each pin-group.
Summary • Microarray experiments have many “hot spots” where errors or systematic biases can apper • Visual and numerical quality control should be performed • Usually intensities will require normalisation • At least global or intensity dependent normalisation should be performed • More sophisticated procedures rely on stronger assumptions Must look for a balance