Download
1 / 1
20 likes | 152 Vues
An Examination of Retirement Income for the 65+ Population Using the SIPP Kathleen Short and Jeremy Skog | Social, Economic, and Housing Statistics Division | United States Census Bureau | 301.763.9114| jeremy.o.skog@census.gov. Motivation – Research Questions.

E N D
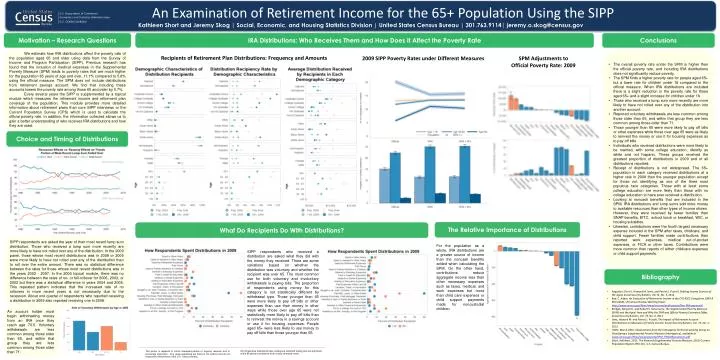
An Examination of Retirement Income for the 65+ Population Using the SIPP • Kathleen Short and Jeremy Skog | Social, Economic, and Housing Statistics Division | United States Census Bureau | 301.763.9114| jeremy.o.skog@census.gov Motivation – Research Questions IRA Distributions: Who Receives Them and How Does it Affect the Poverty Rate Conclusions We estimate how IRA distributions affect the poverty rate of the population aged 65 and older using data from the Survey of Income and Program Participation (SIPP). Previous research has found that the inclusion of medical expenses in the Supplemental Poverty Measure (SPM) leads to poverty rates that are much higher for the population 65 years of age and over, 11.1% compared to 5.8% using the official measure. The SPM does not include distributions from retirement savings account. We find that including these accounts lowers the poverty rate among those 65 and older by 0.7%. Every several years the SIPP is supplemented by a topical module which measures the retirement income and retirement plan coverage of the population. This module provides more detailed information about retirement plans than core SIPP interviews or the Current Population Survey (CPS) which is used to calculate the official poverty rate. In addition, the information collected allows us to gain a better understanding of who receives IRA distributions and how they are used. • The overall poverty rate under the SPM is higher than the official poverty rate, and including IRA distributions does not significantly reduce poverty. • The SPM finds a higher poverty rate for people aged 65+ but a lower rate for children under 18 compared to the official measure. When IRA distributions are included there is a slight reduction in the poverty rate for those aged 65+ and a slight increase for children under 18. • Those who received a lump sum more recently are more likely to have not rolled over any of the distribution into another account. • Reported voluntary withdrawals are less common among those older than 65, and within that group they are less common among those older than 71. • Those younger than 65 were more likely to pay off bills or other expenses while those over age 65 were as likely to reinvest the money or use it for housing expenses as to pay off bills. • Individuals who received distributions were more likely to be married, with some college education, identify as white and not hispanic. These groups received the greatest proportion of distributions in 2009 and of all distributions reported. • Receipt of distributions is not widespread. The 65+ population in each category received distributions at a higher rate in 2009 than the younger population except for those not identifying as one of the three most populous race categories. Those with at least some college education are more likely than those with no college education to have ever received a distribution. • Looking at noncash benefits that are included in the SPM, IRA distributions and lump sums add more money to available resources than other types of income shown. However, they were received by fewer families than SNAP benefits, EITC, school lunch or breakfast, WIC, or housing subsidies. • Likewise, contributions were the fourth largest necessary expense included in the SPM after taxes, childcare, and child support. Fewer families made contributions than reported work expenses, medical out-of-pocket expenses, or FICA or other taxes. Contributions were more common than reports of either childcare expenses or child support payments. Recipients of Retirement Plan Distributions: Frequency and Amounts 2009 SIPP Poverty Rates under Different Measures SPM Adjustments to Official Poverty Rate: 2009 Choice and Timing of Distributions The Relative Importance of Distributions What Do Recipients Do With Distributions? For the population as a whole, IRA distributions are a greater source of income than the noncash benefits added when calculating the SPM. On the other hand, contributions reduce aggregate income less than other necessary expenses such as taxes, medical, and work expenses but more than child care expenses or child support payments made for noncustodial children. SIPP respondents who received a distribution are asked what they did with the money they received. There are some variations based on whether the distribution was voluntary and whether the recipient was over 65. The most common use for both voluntary and involuntary withdrawals is paying bills. The proportion of respondents using money for this category is not statistically different by withdrawal type. Those younger than 65 were more likely to pay off bills or other expenses than use their money in other ways while those over age 65 were not statistically more likely to pay off bills than to reinvest the money in a savings account or use it for housing expenses. People aged 65+ were less likely to use money to pay off bills than those younger than 65. Bibliography • Anguelov, Chris E. Howard M. Iams, and Patrick J. Purcell, Shifting Income Sources of the Aged, Social Security Bulletin, Vol 72, No. 3, 2012 • Bee, C. Adam, An Evaluation of Retirement Income in the CPS ASEC Using form 1099-R Microdata, US Census Bureau Working Paper, http://www.census.gov/hhes/www/income/publications/Bee-PAA-paper.pdf • Bridges, Benjamin, and Robert V. Gesumaria, The Supplemental Poverty Measure (SPM) and the Aged: How and Why the SPM and Official Poverty Estimates Differ, Social Security Bulletin, Vol. 73, No. 4, 2013. • Iams, Howard M. and Patrick J. Purcell, The Impact of Retirement Account Distributions on Measures of Family Income, Social Security Bulletin, Vol. 73, No. 2, 2013. • ITWG. March 2010. Observations from the Interagency Technical working Group on Developing a Supplemental Poverty Measure (Interagency), available at www.census.gov/hhes/www/poverty/SPM_TWGObservations.pdf • Short, Kathleen, 2011. The Research Supplemental Poverty Measure: 2010, Current Population Reports P60-241. U.S. Census Bureau. All comparative statements have undergone statistical testing and are significant at the 90 percent confidence level unless otherwise noted. This poster is released to inform interested parties of ongoing research and to encourage discussion. Any views expressed are those of the authors and do not necessarily reflect those of the U.S. Census Bureau. An account holder must begin withdrawing money from an IRA once they reach age 70.5. Voluntary withdrawals are less common among those older than 65, and within that group they are less common among those older than 71. SIPP respondents are asked the year of their most recent lump sum distribution. Those who received a lump sum more recently are more likely to have not rolled over any of the distribution. In the 2009 panel, those whose most recent distributions was in 2008 or 2009 were more likely to have not rolled over any of the distribution than to roll over the entire amount. There was no statistical difference between the rates for those whose most recent distributions was in the years 2003 - 2007. In the 2006 topical module, there was no difference between the rates of no- or full-rollover for 2006, 2003, or 2002 but there was a statistical difference in years 2004 and 2005. This repeated pattern indicates that the increased rate of no rollovers in more recent years is not necessarily due to the recession. About one quarter of respondents who reported receiving a distribution in 2009 also reported receiving one in 2008. U.S. Department of Commerce Economics and Statistics Administration U.S. CENSUS BUREAU