Download
1 / 44
440 likes | 443 Vues
Learn about cohort study designs, differentiate between prospective and retrospective cohorts, calculate disease frequency measures, and assess the association between risk factors and disease development.

E N D
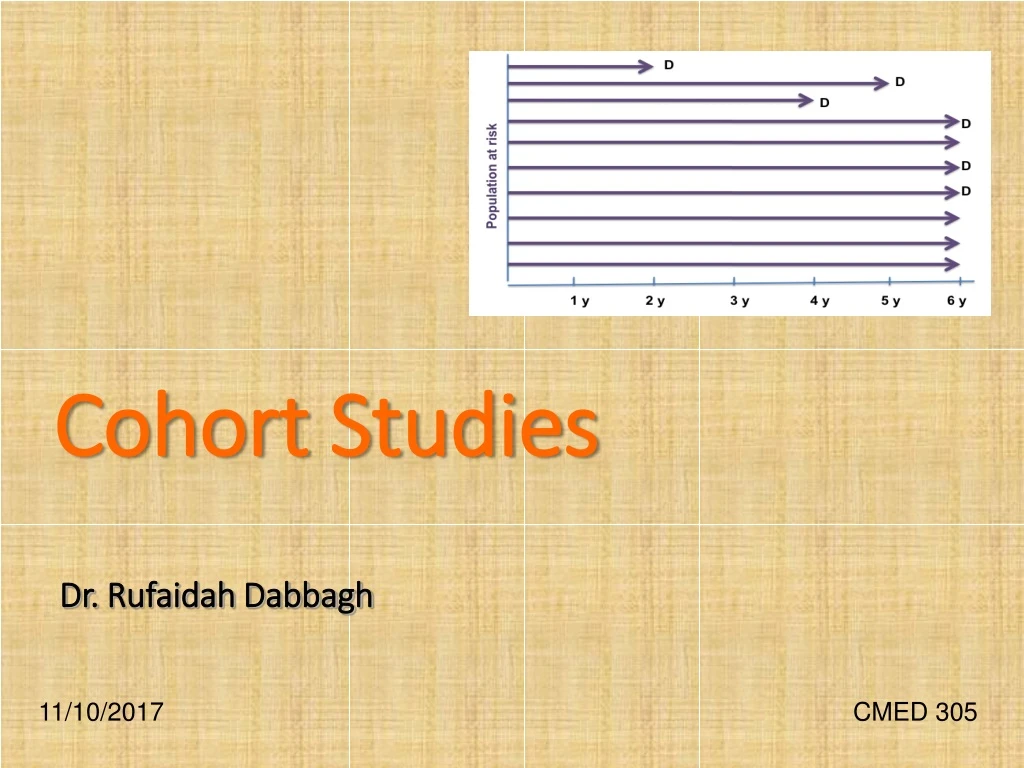
Dr. RufaidahDabbagh Cohort Studies 11/10/2017 CMED 305
Most of the content in this presentation has been retrieved from a previous lecture:
Learning Objectives • To understand what a cohort design is • To differentiate between “a cohort” and a “cohort study” • To differentiate between types of cohort studies; prospective cohort, retrospective cohort • To learn the advantages and disadvantages of a cohort study • To calculate the appropriate measures of disease frequency in cohort studies: incidence, RR, RD
Source: Avila H, Pandey R, Bolla V, Roa H, Avula JK. Periodontal research: basics and beyond –part 1 (defining the research problem, study design and levels of evidence). J Indian Soc Periodontol 2013; 17(5): 565-70.
Design of Cohort StudiesWhat is a cohort ? • Cohort: group of individual with a common characteristic who are followed over a period of time e.g. A smoker’s cohort means all are smokers in that group; birth cohort; class cohort • Cohort study design: selection of cohorts based on exposed and unexposed individuals, and following them over specified time or until development of outcome (disease/death)
Design of Cohort Studies cont. • And so in a cohort study we select individuals based on their exposure to a specific risk factor (exposed group and non-exposed group) • It I important that these people are free of the disease at the beginning of the study • then we follow them over a certain period of time and record the following measures: • Total number of people at risk at the beginning (total at risk at baseline) • Time until the development of the disease (time at risk) • Number of new cases that have developed the disease • Number of people who were lost to follow-up
Direction of Investigation Time in Study Designs Etikan I, Abubakar S, Alkassim R (2017) Frequency Measures of Epidemiological Studies. Biom Biostat Int J 5(1): 00124.
What is a Risk? • Risk is the possibility of harm • In epidemiology risk is the likelihood of an individual in a defined population to develop a disease or other adverse health problem • It is usually used to refer to the incidence proportion
What is a Risk Factor? • A risk factor is a characteristic associated with disease. • In cohort studies, we measure the exposure to a certain risk factor (exposure or non-exposure), and then we calculate the risk for developing the disease based on the exposure • We then assess the association between risk factor exposure and development of disease by comparing the Risks in the two groups (exposed and non-exposed); i.e. compare the incidence proportions
Population at Risk The population at risk in a cohort study is a well-defined population that is free of the disease at the beginning of the study and has certain characteristics that put them at risk for developing the disease Eg. Population at risk in a study of carcinoma of cervix
Follow-up in a Cohort Study D D D D D Population at risk D 1 y 2 y 3 y 4 y 5 y 6 y # of people at risk at baseline? # of cases developed during the 6 year follow-up period? Total person-time at risk?
Follow-up in a Cohort Study D D D D D Population at risk D 1 y 2 y 3 y 4 y 5 y 6 y # of people at risk at baseline? 10 # of cases developed during the 6 year follow-up period? 6 cases Total person-time at risk? 2+5+4+6+6+6+6+6+6+6= 53 person-years
Follow-up in a Cohort Study D D D D D Population at risk D 1 y 2 y 3 y 4 y 5 y 6 y What is the risk at year 4?
Follow-up in a Cohort Study D D D D D Population at risk D 1 y 2 y 3 y 4 y 5 y 6 y What is the risk at year 4? 2 / 10 = 0.2
Follow-up in a Cohort Study D D D D D Population at risk D 1 y 2 y 3 y 4 y 5 y 6 y What is the risk between 3y and 5y? What is the prevalence between 3y and 5y?
Follow-up in a Cohort Study D D D D D Population at risk D 1 y 2 y 3 y 4 y 5 y 6 y What is the risk between 3y and 5y? 2/ 9 = 0.22 What is the prevalence between 3y and 5y? 3 / 10 = 0.33
What are we assessing in a Cohort study? Are exposure and disease linked? Direction of inquiry in cohort study E D Exposure Risk factor e.g. Tobacco chewing Disease (outcome) e.g.Myocardial Infarction (MI)
DEVELOP DISEASE DEVELOP DISEASE Design of a Cohort Study EXPOSED NOT EXPOSED DO NOT DEVELOP DISEASE DO NOT DEVELOP DISEASE
DEVELOP DISEASE DEVELOP DISEASE Defined population 2011 Current time Data from 1995/ Retrospective Select based on exposure Prospective EXPOSED NOT EXPOSED Current time 2011 2025 DO NOT DEVELOP DISEASE DO NOT DEVELOP DISEASE • There are two types of cohort studies: • 1. Prospective • 2. Retrospective
Prospective Cohort Study Disease occurs Exposed No disease Disease occurs Unexposed No disease 2011 Present Future time
Prospective Cohort Study cont. • In a prospective cohort the investigator identifies the population at risk at the beginning of the study, and their exposure to the risk factor (determine who is exposed and who is not) • Then follows them up through a period of time to see who develops the disease and who does not
Retrospective Cohort Study Disease occurs Exposed No disease Disease occurs Unexposed No disease Examine exposure in historical data (medical records, survey data….etc) 1995 Past Present 2011
Retrospective Cohort Study cont. • In a retrospective cohort, the investigator searches in the medical records (already collected data) to see who had the exposure and who did not and also who developed the disease and who did not • Note that here the recording of the exposure and the disease all happened in the past, but the records have enough information to determine the timeline of events (that the exposure happened before the disease)
Retrospective Cohort compared to Prospective Cohort • Advantages: • In retrospective there is less time consumed for the study (the data is already there) • Retrospective is cheaper than prospective cohort • Retrospective is suitable for diseases that take a long time to develop (e.g. cancers, Parkinson's, etc.) • Disadvantages: • Some times difficult to determine the accuracy of the historical data in retrospective studies
The Framingham Study • Began in 1948 for Cardiovascular disease • A small town 20 miles from Boston in Massachusetts, USA • Population under 30,000 • Participants between 30-62 years of age ..why? • Follow up for 20 years • Sample size of 5000 Other famous cohorts include; British Physicians Cohort UK; Nurses Health Study USA, Women Health Initiative (WHI), Study of women across the nation (SWAN) in USA
Framingham Study Exposure Outcome • Smoking • Obesity • Elevated blood pressure • Elevated Cholesterol levels • Physical activity • New Coronary events determined by -Daily surveillance -Examination / 2 years
Nurses Health Study Nurses' Health Study, a large cohort study involving over121,700 women, who enrolled in 1976 from eleven states of USA; using a questionnaire in mail every two years to determine Exposure • Biological • Demographic • Hormonal • Lifestyle • Nutritional and • Other risk factors. Outcomes in • Chronic diseases, • Cancer in general • Cancers related to female reproductive tract
Meta-analysis and systematic reviews of RCTs RCTs followed by non-randomized CTs Cohort studies Case-control studies Cross-sectional Studies Case-series Case-reports Traditional Evidence-based Medicine Pyramid Source: Murad MH, Asi N, Alsawas M, Alahdab F. New evidence pyramid. Evid Based Med 2016; 21(4): 125-7
The Cohort study design provides the best evidence compared to other observational studies Why? The temporal relationship between exposure and disease is clear (i.e. we know that the exposure occurred before disease, so it provides stronger evidence for possible causation relationship)
What can measure in cohort study? D D D D D Population at risk D 1 y 2 y 3 y 4 y 5 y 6 y # of people at risk at baseline # of cases developed during the 6 year follow-up period Total person-time at risk
What can we measure in a Cohort study? • Risk (incidence proportion) • Rate (incidence rate) • Prevalence • Risk Ratio (relative risk) • Risk Difference • Attributable Risk Fraction
Analysis in Cohort Studies The basic analysis involves: • Calculation of incidence proportion among the exposed • Calculation of incidence proportion among the non-exposed • Compare the two by calculating the Risk Ratio • We can also calculate the “incidence rates”, because we measure the time during which individuals were at risk (i.e. person-time at risk)
Risk Ratio (RR) RR = Incidence in exposed = a/a+b Incidence in unexposed c/c+d What does RR=1 means ? What does RR > 1 mean? RR < 1?
Interpretation of Risk Ratio (RR) RR=1: No associationbetween exposure and disease incidence proportions are identical between groups RR> 1: Positive association (increased risk in exposed) exposed group has higher incidence than unexposed group RR< 1: Negative association (decreased risk in exposed) unexposed group has higher incidence than exposed group. This means the exposure could probably be protective
Example: Risk Ratio Calculation Cohort study following up individuals for 1 year Incidence in smokers = 84/3000 = 0.028 Incidence in non-smokers = 87/5000 = 0.0174 Risk ratio = 0.028/0.0174 = 1.61
Risk Difference • The difference between the Risk of the disease in the exposed to unexposed • RD= R e– Ru Attributable Risk Fraction (Excess Fraction) • The excess proportion of cases that is attributed to exposure • ARF= (R e– Ru) / Re R=Risk. e= exposed, u=unexposed
Attributable Risk Fraction • What is the excess proportion of CHD cases that is attributed to smoking? • ARF= (84/3000) – (87/5000) ≈ 0.38 = 38% (84/3000) This means that 38% of excess CHD cases are attributed to smoking in this study We can also say: 38% of the cases of CHD among the smokers could be have been prevented if they had not smoked
Potential Biases in Cohort Studies Bias refers to any systematic error in the study (design or analysis) that results in a mistake in our estimates In a cohort study bias can arise from: • Non response=> people do not participate • Loss to follow up => people leave • Error in measuring exposure or outcome => mistakes in the classification of the exposure or the disease In addition to other sources of bias encountered in other study designs
Advantages of Cohort studies Useful in rare exposures. Can study multiple outcomes of a single exposure / risk factor. Certain about the temporality of exposure and disease (disease occurs after exposure) We can calculate incidence proportion and rate Can quantify Risk Ratio and Risk Difference Provides better evidence than case-control study, and cross-sectional study Can establish a natural history of disease when not known
Disadvantages of Cohort studies There is potential for loss to follow up, especially in diseases that take a long time to develop Measurement errors, multiple interviews, tests Not suitable for evaluation of rare diseases Takes a long time (if prospective) More expensive than case-control and cross-sectional studies Provides weaker evidence than RCTs
Summary • Cohort studies are observational in nature ( but also analytical) and are useful in comparing risks in subgroups of populations within a specific time frame • Availability of data from previous years can lead to less expensive estimates for Risk, RR, and RD, using a retrospective cohort study • Prospective Cohort studies are expensive in time and resources • When a cohort is conducted accurately, estimates of Risk, RR and AR can help make inferences about a causal link between risk factors and disease/other outcomes e.g. cancer.
References • Gordis L. Epidemiology. 4th Edition. Philadelphia, PA: Saunders Elsevier; 2009. • Rothman KJ, Greenland S, Lash TL. Modern Epidemiology. 3rd Edition. Philadelphia, PA: Lippincott Williams and Wilkins; 2008.