Download
1 / 42
430 likes | 610 Vues
The Big Bang. How did the universe begin … and how do we know?. This unit explores theories of the origins of the universe and our current place in that universe in the context of Human Ingenuity and the One World criterion.

E N D
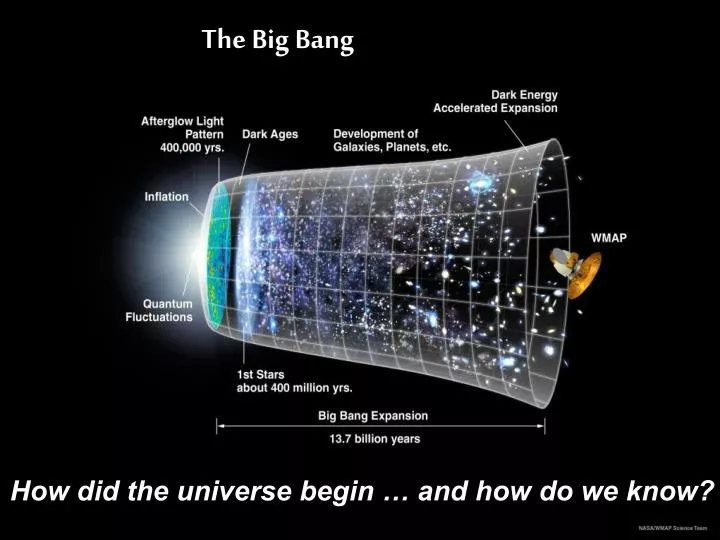
The Big Bang How did the universe begin … and how do we know?
This unit explores theories of the origins of the universe and our current place in that universe in the context of Human Ingenuity and the One World criterion. In doing so, the unit encourages questions about how scientific theories are developed and what scientific knowledge is. Assessment: Formative: Textbook questions, class notes. Summative: Big Bang Poster (Criteria B & C) One World Essay (Criteria A, B & C)
Before we look at how the universe began, let’s look at What the universe is made of (what we know) What techniques we use to gather evidence about the universe (how we know)
We have never seen dark matter or dark energy and don’t know where it comes from, we just know it is there. It is one of the unsolved mysteries of science. Maybe you can solve the problem … http://hetdex.org/images/dark_energy/universe_made_of.jpg
We think that Dark Matter exists because some kind of mass is gravitationally affecting the way stars and galaxies move. An X-ray image taken by the ROSAT satellite, placed over a photo of a group of galaxies. The image shows (in pink) a gigantic cloud of hot "gas" that emits a weak amount of X-rays. The presence of this gas leads us to believe that there is a strong gravitational attraction capable of keeping it there; the mass of the visible galaxies alone would not be enough. Therefore there must be dark matter hidden amongst the galaxies of a cluster.Credit:Dr. R.Mushotzky Nasa Goddard Space Flight Center) We think that Dark Energy is there because it helps to explain why the expansion of the universe is accelerating. Science magazine’s “Breakthrough of the Year” for 1999!
Only 5% of our universe is made up of matter, such as stars. These stars are far from static. They, too, have a life cycle. http://www.factmonster.com/images/ESCI168NEBULA002.jpg
The fascinating, and humbling, thing about the life cycle of stars is that everything, including you and me, is made of STARDUST. We, too, are part of the life cycle of stars.
We know these things by using a wide variety of scientific techniques for finding evidence to support our theories. Here are a few of them … Let’s look at these in a little more detail …
How Far, How Bright? Which of the stars A or B are closer to the earth? Give reasons for your choice.
To determine which is closer we can use parallax. Hold out your thumb at arm's length, close one of your eyes, and examine the relative position of your thumb against other distant (background) objects, such as a window, wall, a tree, etc. Now look at your thumb with your other eye. What do you notice? Move your thumb closer to your face and repeat the experiment. What was different this time? Watch this applet to see how parallax works in Astrometry – the measurement of distance and position in Astronomy. http://www.astro.ubc.ca/~scharein/applets/Sim/new-parallax/Parallax.html
We need to be careful here because these diagrams are not to scale. The parallax to the nearest star system, Alpha Cenauri, is 0.74212 arcseconds. 1 arcsecond = 1/3600 of a degree 1 parsec = 3.26 light years 1 light year = 9.46 x 10¹² km 1 parsec = 3.086 x 10¹⁶ m 1 parsec = 3.086 x 10¹³ km 1 Astronomical Unit (AU) = 1.496 x 10¹¹ m 1 parsec = 2.063 x 10⁵ AU
The parallax to the nearest star system, Alpha Centauri, is 0.74212 arcseconds. Using the previous data, calculate the distance of Alpha Centauri in parsecs.
Can you think of a problem with parallax? For stars that are very far away, parallax is too difficult to determine. Even most stars within our own galaxy cannot have their distance measured using parallax.
Another way to determine the distance to a star is BRIGHTNESS. Brightness is measured on a scale called apparent magnitude. It’s important to realise that a star also has absolute magnitude, it’s actual brightness. The two magnitudes are related by the distance of the star from the observer.
Magnitudes are effectively a logarithmic scale. The change of 5 in magnitude corresponding to a factor of 100 is equivalent to the statement b5 = 100, or 5 = logb100, where b is the base of the log scale. To make this true, b has to be close to 2.512 because 2.5125 = 100 (try it on your calculator). This means that an increase in the apparent brightness of 1 on the magnitude scale corresponds to about 2.5 times the brightness.
Here is a familiar part of the night sky. Can you identify any objects? Which are the brightest? Alpha Centauri -0.04 Acrux 0.75 Beta Centauri 3.93 Eta Carinae 6.46 Becrux 1.25
We can also measure absolute magnitude using Luminosity. Luminosity and apparent brightness are related in an inverse square law. Do question 3 a from Check! And question 3 a – c from Challenge.
Luminosity and brightness are not the only sources of information in the light coming from a star. Another incredibly rich source of information is a star’s COLOUR. Colour is just another way of saying “wavelength” of light.
The colour of a star can tell us • What it is made of (using spectroscopy) • What temperature it is (using blackbody radiation)
Spectroscopy Spectroscopy is the technique of splitting light (or more precisely electromagnetic radiation into its constituent wavelengths).
All matter absorbs or emits light in a particular spectrum (each line is associated with an energy level – you would remember this from the elctron shells you studied in Chemistry. So spectroscopy allows us to find out what things are made of.
Early spectroscopy focussed on our closest and favourite star … http://www.boston.com/bigpicture/2008/10/the_sun.html
The sun radiates in all parts of the electromagnetic spectrum, not just in the visible light that we are accustomed to observing. These images show what the sun would look like if we could “see” at different wavelengths of electromagnetic radiation.
Here are some examples of what spectroscopy tells us Spectra of the Elements Applet: Spectral Lines Applet: http://mo-www.harvard.edu/Java/MiniSpectroscopy.html http://jersey.uoregon.edu/vlab/elements/Elements.html
Blackbody Radiation All objects with a temperature above absolute zero (0 K, -273.15 oC) emit energy in the form of electromagnetic radiation. A blackbody is a theoretical or model body which absorbs all radiation falling on it, reflecting or transmitting none. It is a hypothetical object which is a “perfect” absorber and a “perfect” emitter of radiation over all wavelengths. The spectral distribution of the thermal energy radiated by a blackbody (i.e. the pattern of the intensity of the radiation over a range of wavelengths or frequencies) depends only on its temperature. http://astronomy.swin.edu.au/cms/astro/cosmos/B/Blackbody+Radiation
The characteristics of blackbody radiation can be described in terms of several laws: 1. Planck's Law of blackbody radiation, a formula to determine the spectral energy density of the emission at each wavelength(Eλ) at a particular absolute temperature (T). (Not examinable!)
2. Wien's Displacement Law, which states that the wavelength() increases in an inversely proportional relationship with temperature (T). 3. Stefan–Boltzmann Law, which relates the energy emitted (E) or the Luminosity (L) to the absolute temperature (T) and the radius of the star (R). (Not examinable!) The Stefan–Boltzmann constant, , is given by 5.67 x 10⁻⁸ Wm-2K-4.
This applet shows us a practical application of these laws. Blackbody Radiation Applet: http://www.mhhe.com/physsci/astronomy/applets/Blackbody/frame.html
H-R Diagrams In 1911 Danish astronomer, Ejnar Hertzsprung, plotted the absolute magnitude of stars against their colour. Independently in 1913 Henry Russell plotted spectral class against absolute magnitude. Their combined efforts resulted in a chart that is as important to Astrophysicists as the Periodic Table is to chemists – the Hertzsprung-Russell diagram.
At the bottom-right of the diagram we can see two named stars, Proxima Centauri and Barnard's Star. These are both cool (approximately 2,500 K) and dim (absolute magnitudes of about -13). Following the broad band straight up we come across Mira, also cool but much more luminous. Travelling further up we come across Antares and Betelgeuse. Again these stars are cool but they are extremely luminous. Why do these three groups differ so much in luminosity?
The answer to this question depends upon the Stefan-Boltzmann relationship. If two stars have the same effective temperature they each have the same power output per square metre of surface area. So a star that is much more luminous than the other it must have a much greater surface area. The more luminous star is bigger.
If we look at the vertical band on the H-R diagram for hotter stars around type A spectral class we see a similar pattern:
If we compare the dimmest stars on the H-R diagram we can also make some inferences. The following diagram shows the lower region of the H-R diagram. Procyon B and Barnard's Star share the same low luminosity with an absolute magnitude of about +13. Procyon B is much hotter than Barnard's Star. Given that they have the same total power output Procyon B must therefore have less surface area than - its radius is smaller.